

For very large data sets with thousands of samples it is recommended to use GrapeTree for drawing a Minimum Spanning Tree (MST).
Installation of GrapeTree on WSL
GrapeTree can be installed into a conda environment using the following command on Windows Subsystem For Linux (WSL). Open the start menu, type 'wsl' and choose to execute it.
When the black WSL console window has started up, enter the command:
conda create --name grapetree -c bioconda grapetree
Creating a GrapeTree MST from a SeqSphere+ Comparison Table
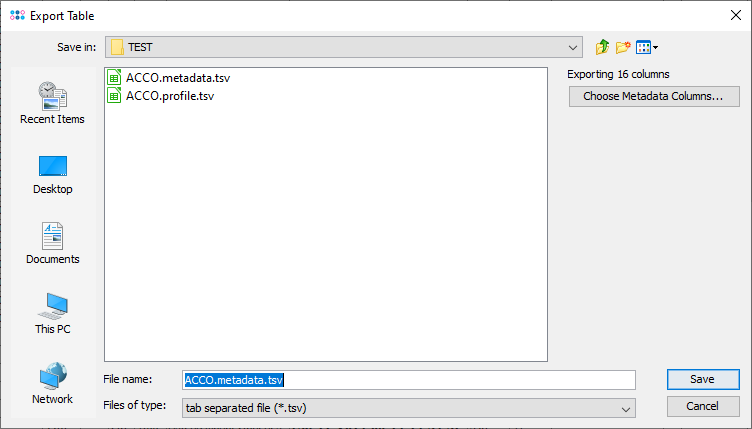
- Step 1: Choose in the comparison table menu the function File | Export profile and metadata files for GrapeTree (tsv). This function will create two TSV files: one profile file, containing the allelic profiles and one metadata file, containing the epi metadata from the comparison table. To be accessible from the WSL, these files must be saved locally on your computer, i.e. on you C or D drive, not on a network drive.
- Step 2: The exported profile file can now be used to calculate a MST with GrapeTree and store it as NWK (Newick) file.
- Open a Linux terminal or start WSL. Then change to the folder where exported profile file is located (on WSL the windows path must be used, e.g.,
/mnt/c/Users/<windowsusername>/Desktop). - Now start calculating with the following command line:
conda run -n grapetree grapetree -n NUMBER_OF_PROCESSES -p PROFILE_FILE > NWK_FILE
- where NUMBER_OF_PROCESSES is the number of cores that should be used for calculation (default 5), PROFILE_FILE is the path to the profile file, and NWK_FILE is the path for the desired output file in Newick format (file name should have extension ".nwk").
- You may get a NumbaPendingDeprecationWarning message, which can be ignored.
- Step 3: The created NWK file can now be import to GrapeTree. Execute the GrapeTree local server with following command:
conda run -n grapetree grapetree
- A webbrowser will automatically open with URL http://127.0.0.1:8000/.
- Step 4: The GrapeTree page will be shown. Press Load Files button and import first the NWK file and then the metadata file created by SepSphere+. Further information about loading the files and modifying the tree layout can be found in the Grape Tree tutorial.
Runtime and Memory usage
Following table contains the runtime and memory usage for calculation and visualization of Mycobacterium tuberculosis samples.
| No. of Samples | Intel i7, 4 cores, WSL | Intel Xeon, 5 cores Linux | Intel Xeon, 10 cores, Linux |
| 5k | 2m (5GB) | 2m (5GB) | 1m (5GB) |
| 10K | 8m (18GB) | 6m (18GB) | 2m (18GB) |
| 15k | 14m(19GB) | 10m (20GB) | 7m (20GB) |