

Contents
Introduction
Here we compare the long-read data de novo assemblers that are supported by Ridom Typer. Although Trycycler is regarded among the best long-read only assemblers, it was was not evaluated and integrated as it requires multiple manual interventions in each assembly so that it cannot be fully automized.
Methods
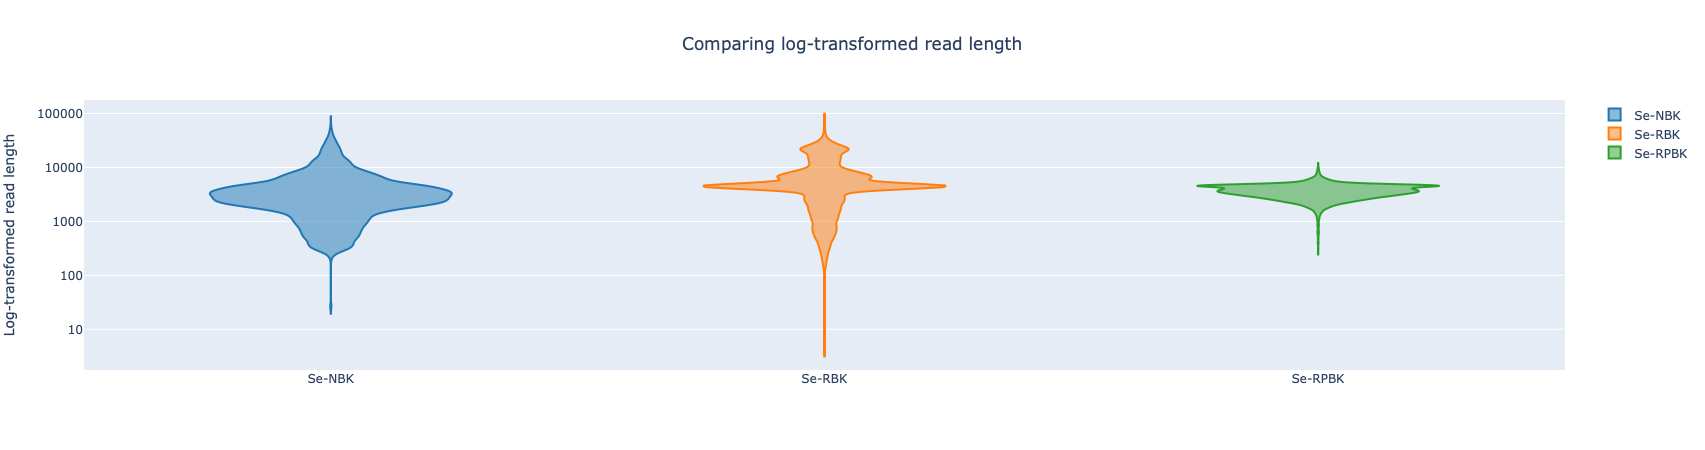
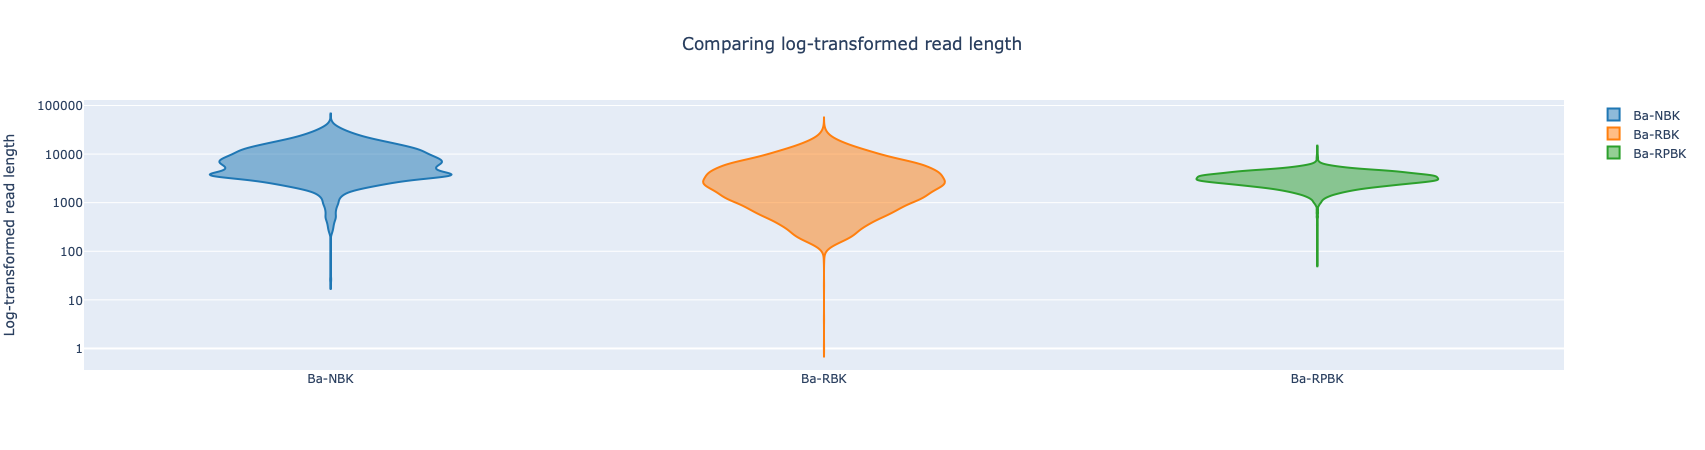
Two strains with finished NCBI RefSeq genomes were re-sequenced on an Oxford Nanopore MinION. All DNA extraction was done with the Zymo Biomics DNA Miniprep kit (Zymo Research; Freiburg, Germany). Native Barcoding Kit (NBK), Rapid Barcoding Kit (RPK), and Rapid PCR Barcoding Kit (RPBK, with NEB LongAmp Taq) library preparations were used and then loaded on a MinION R10.4.1 flowcell. Base calling was performed using Dorado (v0.5.3) with model dna_r10.4.1_e8.2_400bps_sup@v4.3.0. Before assembling the reads were trimmed with Chopper (v0.7.0; with quality 10 and minimum length 500) and downsampled to different estimated coverages. Rasusa (v0.8.0) was used for downsampling, with exception of the charts were FiltLong (v0.2.1) was used. The assembly of the data was performed with the two different long-read de novo assemblers that are available in Ridom Typer: Flye (v2.9.3, with option --nano-hq ) and Raven (v1.8.3). Medaka (v1.11.3) was used for polishing the consensus sequences with model r1041_e82_400bps_sup_v4.3.0. For the resulting contigs an allele calling was done with Ridom Typer using cgMLST seed-only schemes based on the NCBI GenBank entry of the same strain. Plasmid reconstruction was performed by MOB-recon (v3.1.8). All charts were generated with the in Ridom Typer integrated tools except the read-length images that were produced with NanoComp (v1.23.1). The runtimes were measured on an Intel Xeon system with 20 cores (two E5-2630) and 192 GB memory. The G/C content of the two strains is 32% for Staphylococcus epidermidis strain ATCC 12228 (AE015929.1; 2.5 MBases genome) and 56% for Brucella anthropi strain ATCC 49188 (NC_009667.1/NC_009668.1; 4.8 MBases genome).
The following parameters were compared for different coverages and the two assemblers:
- Assembler Preprocessing Time
- The time the read trimming (Chopper) and downsampling (Rasusa or Filtlong) took
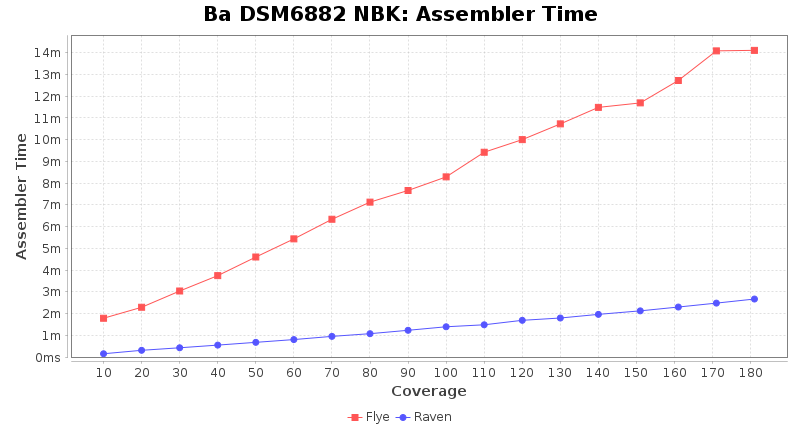
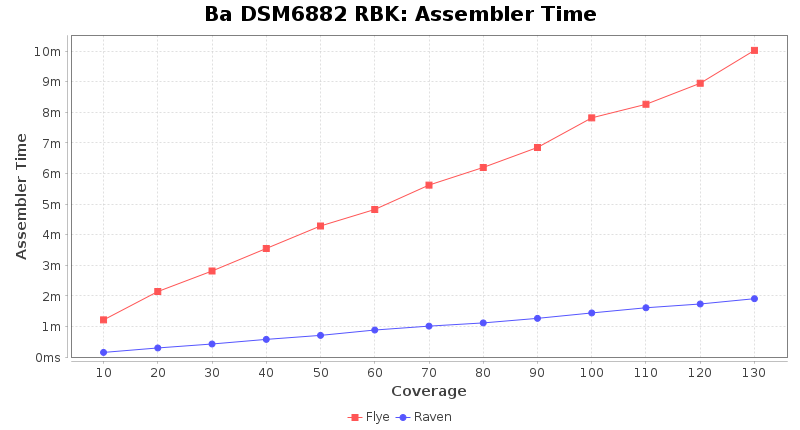
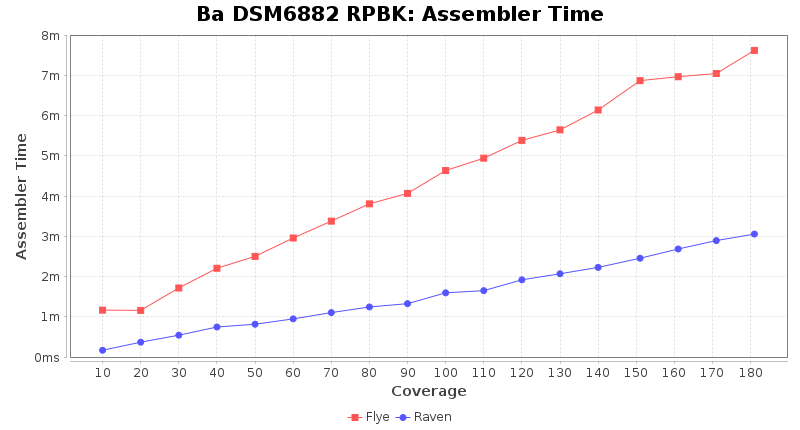
- Assembler Runtime Time
- The time the assembler (Flye or Raven) took
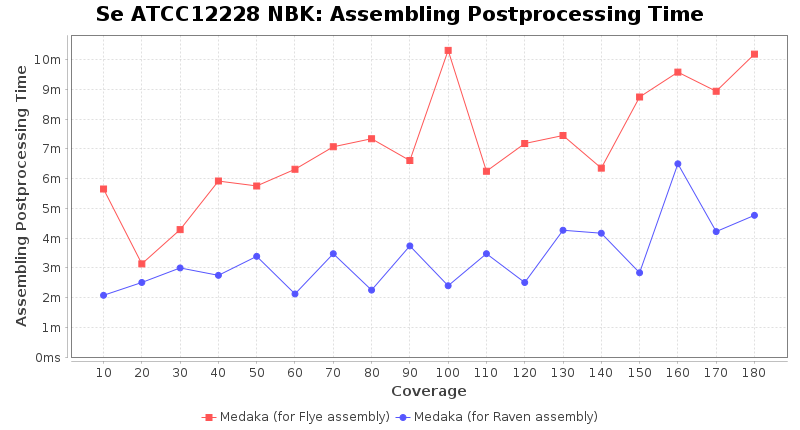
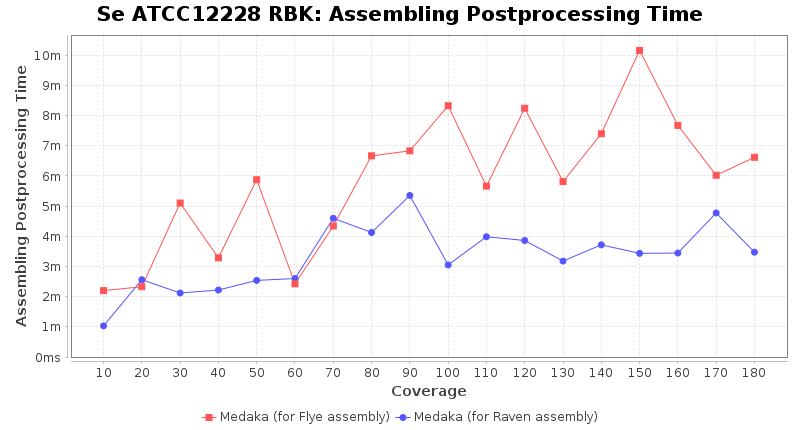
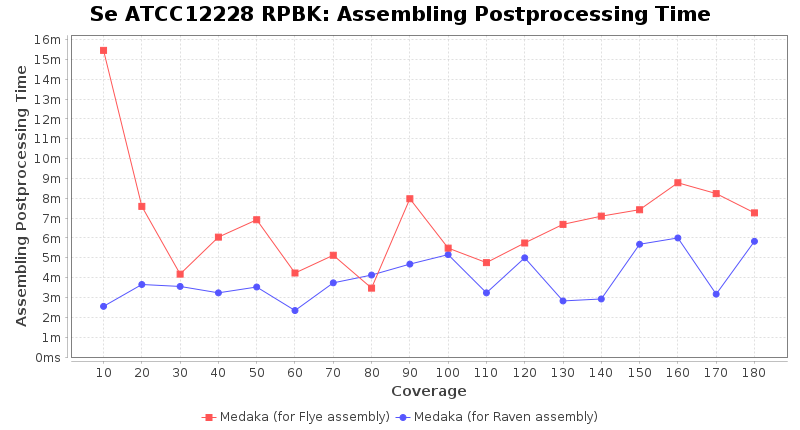
- Assembler Postprocessing Time
- The time the assembly polishing (Medaka) took
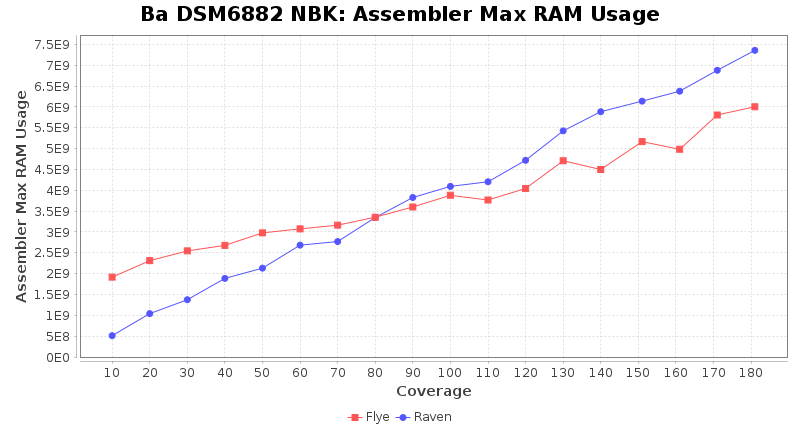
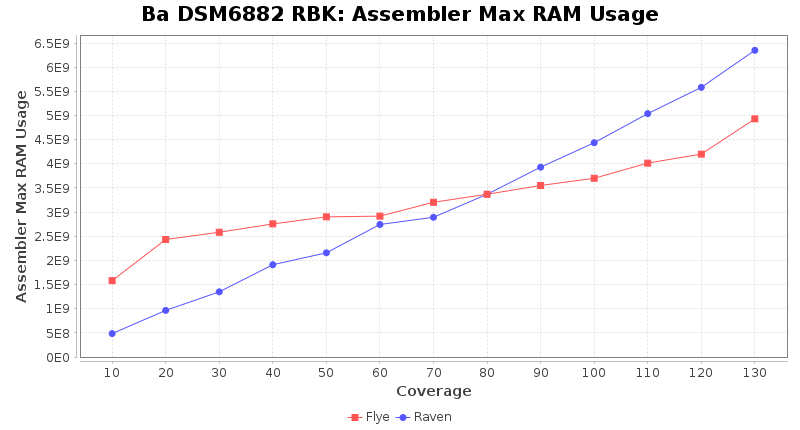
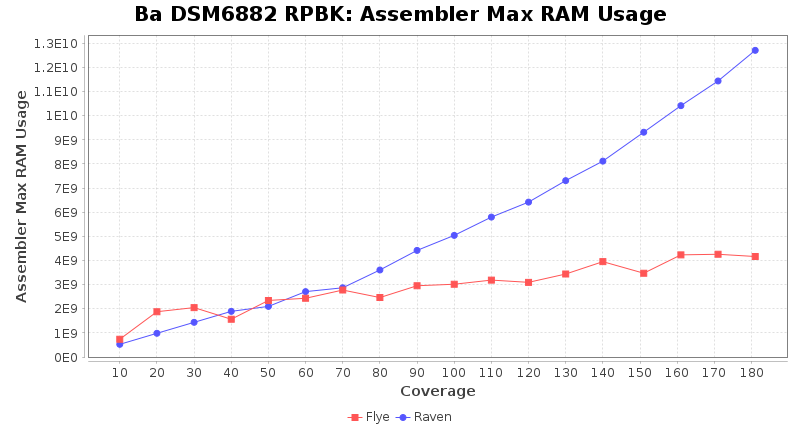
- Assembler Max RAM
- The peak RAM used by the assembler
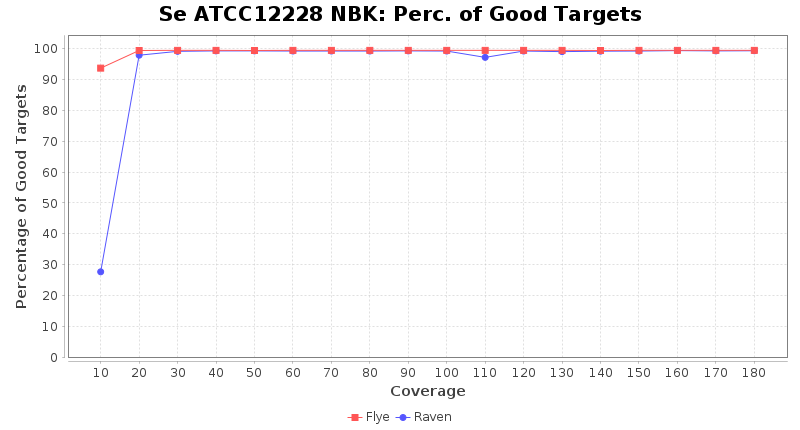
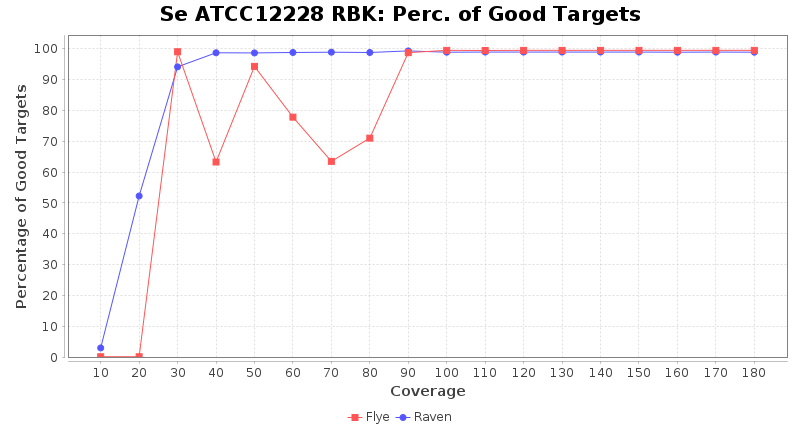
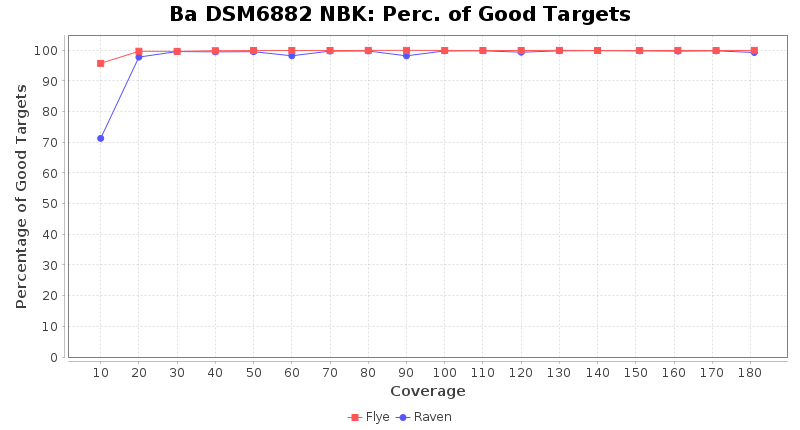
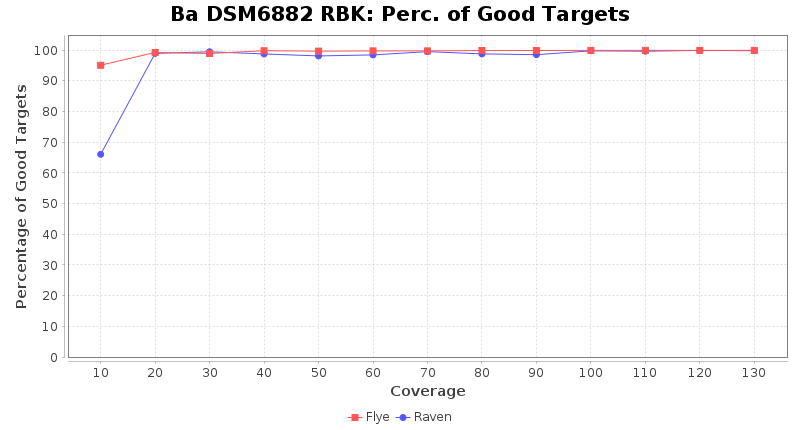
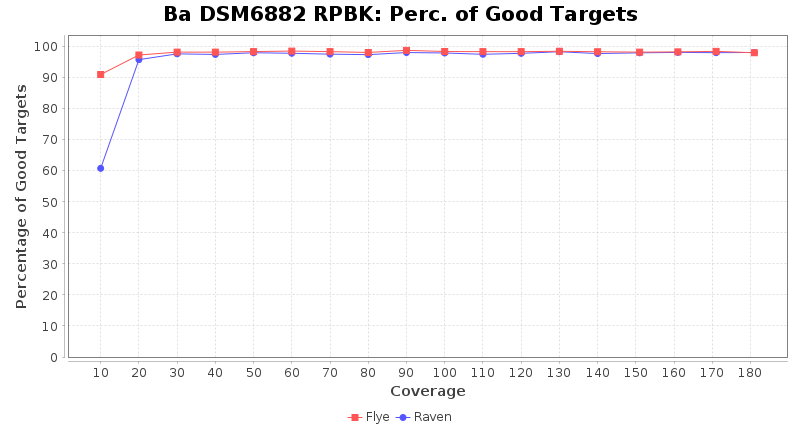
- Percentage of Good cgMLST Targets
- The number of targets that pass the quality check in a seed-only cgMLST task template that was defined with the downloaded NCBI genome of this strain (larger values are better)
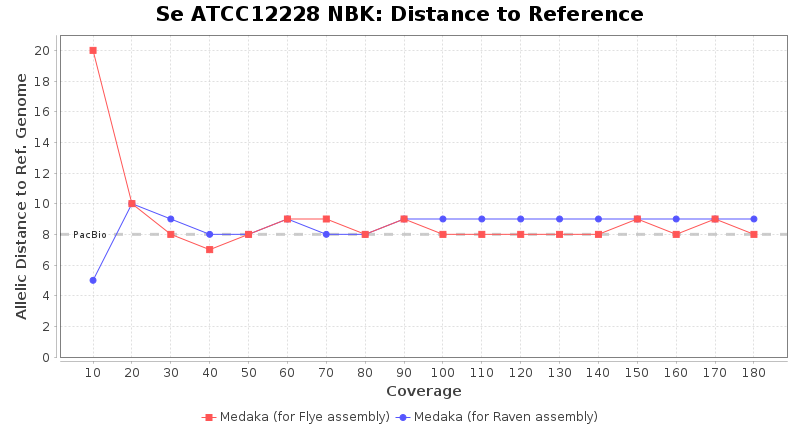
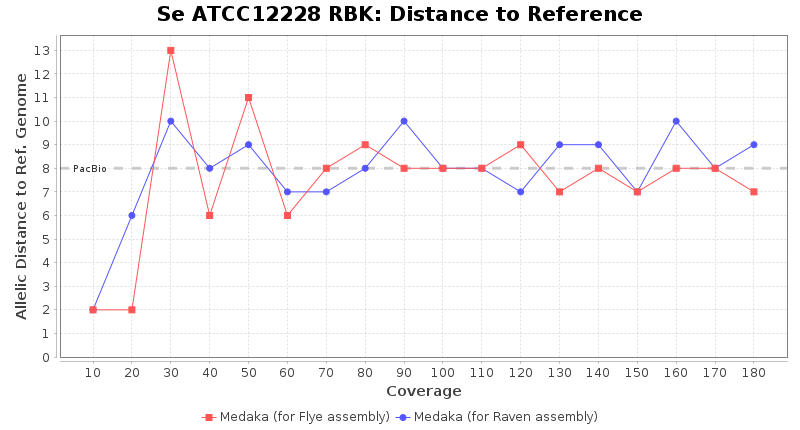
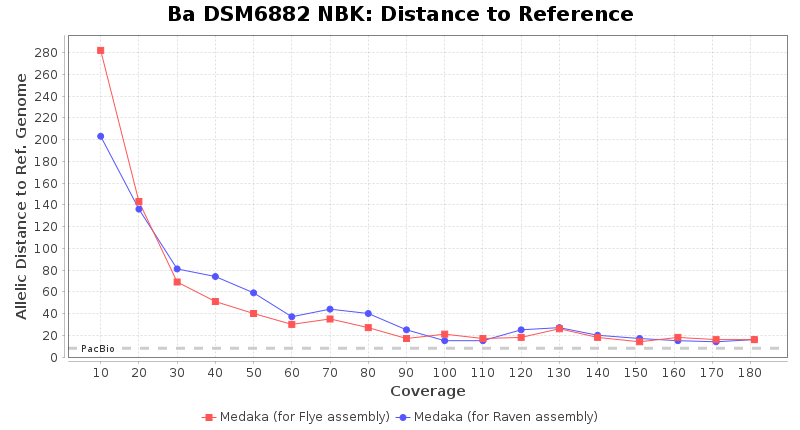
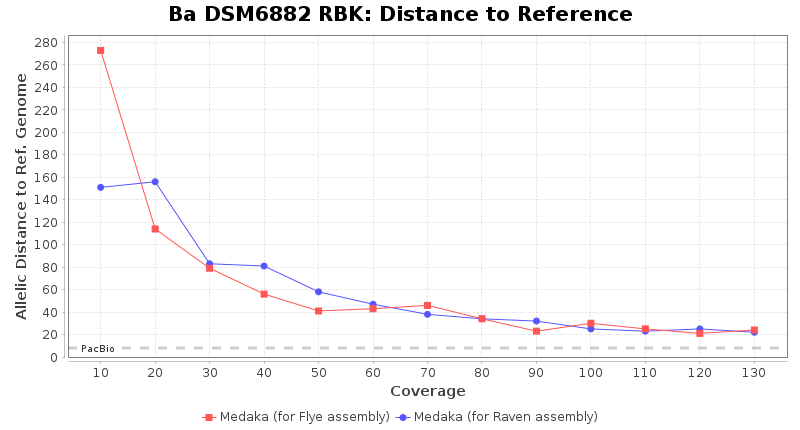
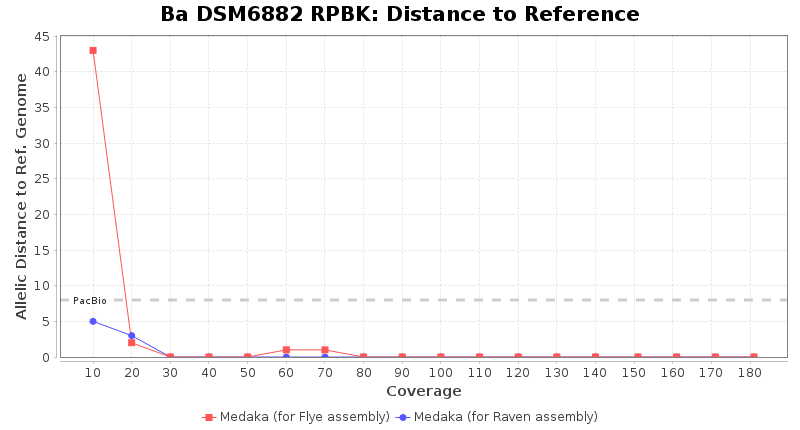
- Distance to Reference (Seed)
- The absolute number of differing target alleles between the assembly and the downloaded NCBI genome of this strain (smaller values are better, but will never be zero due to sequencing errors in the finished NCBI genome and/or micro-evolutionary changes of the here sequenced culture collection strain during multiple sub-cultivation passages)
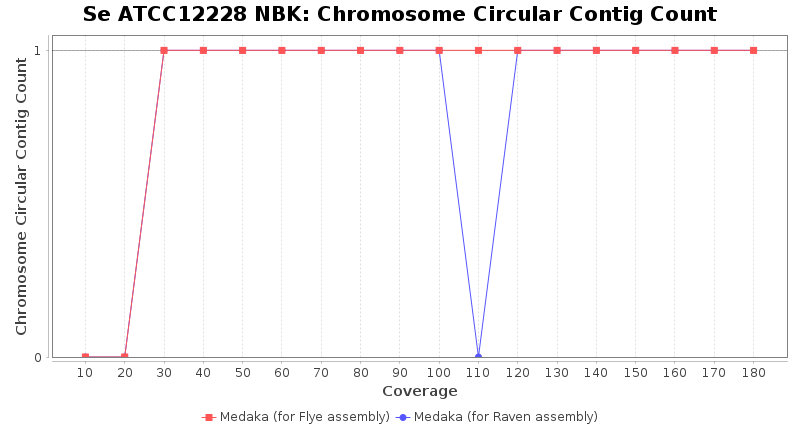
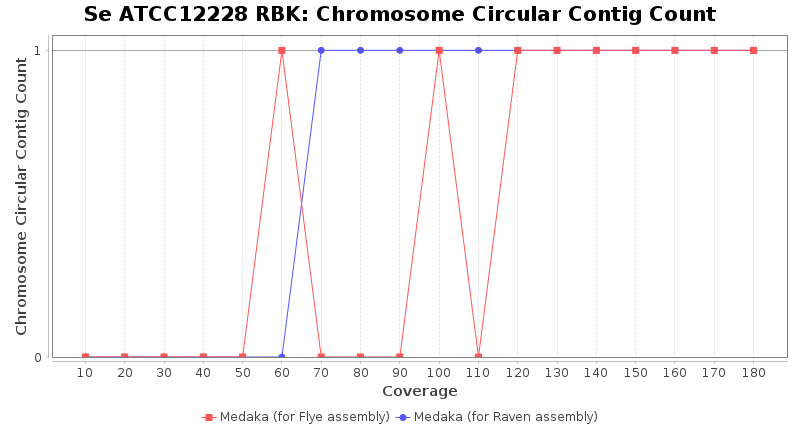
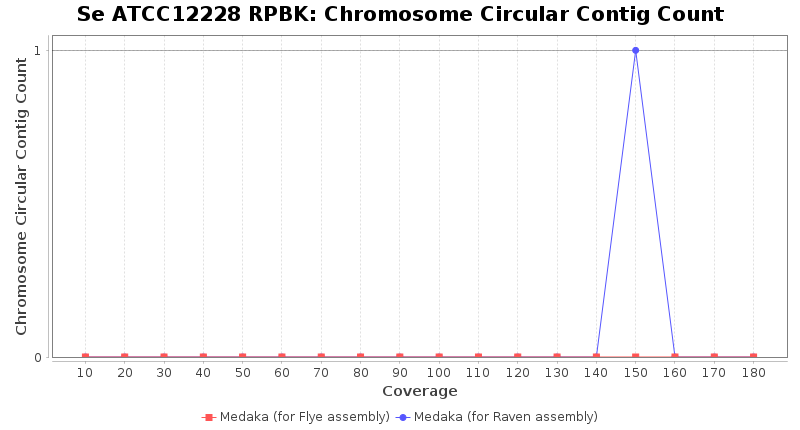
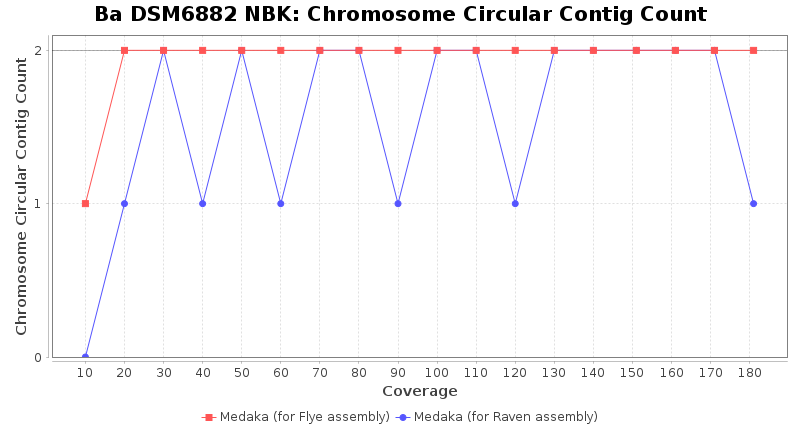
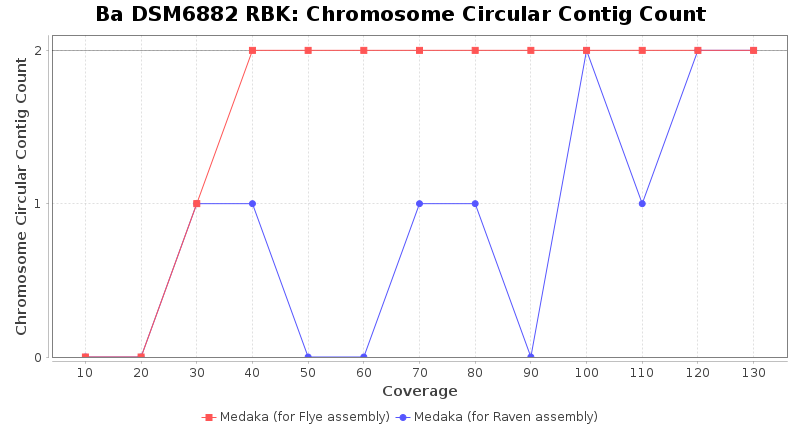
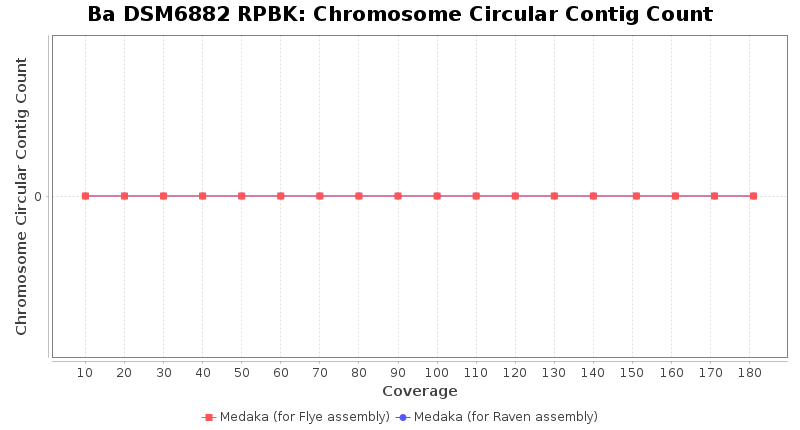
- Chromosome Circular Contig Count
- The number of contigs that were detected as circular and chromsome by MOB-recon
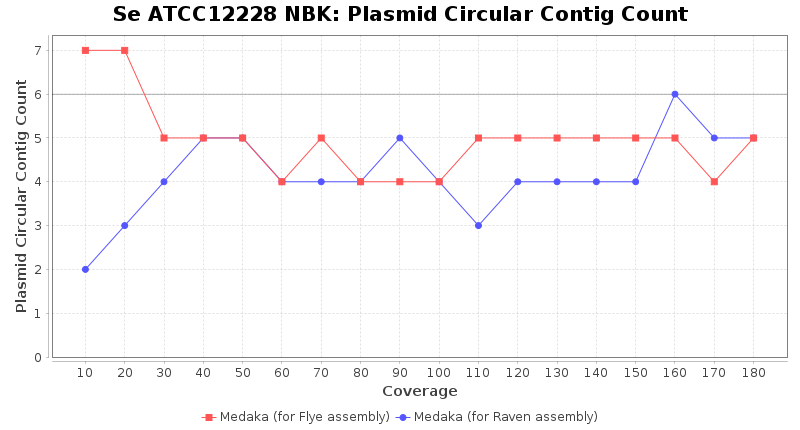
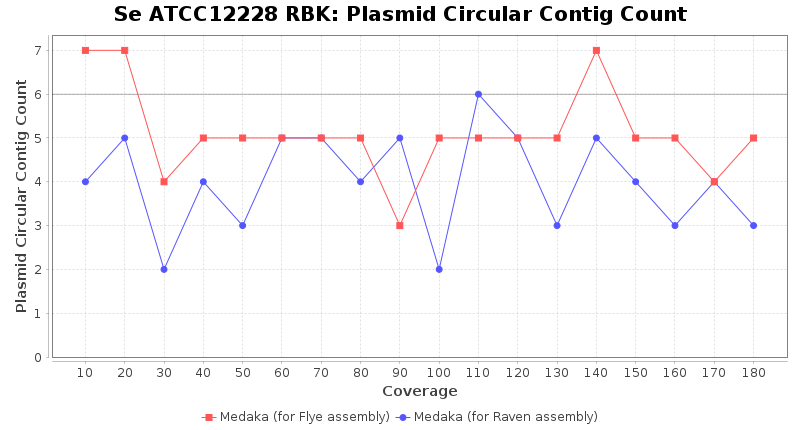
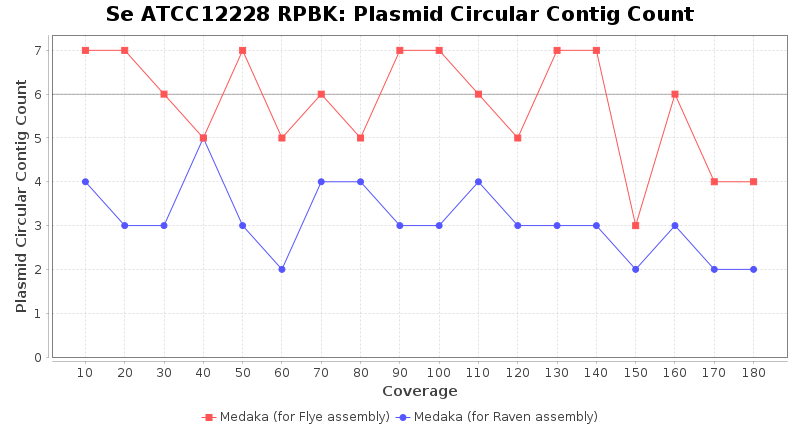
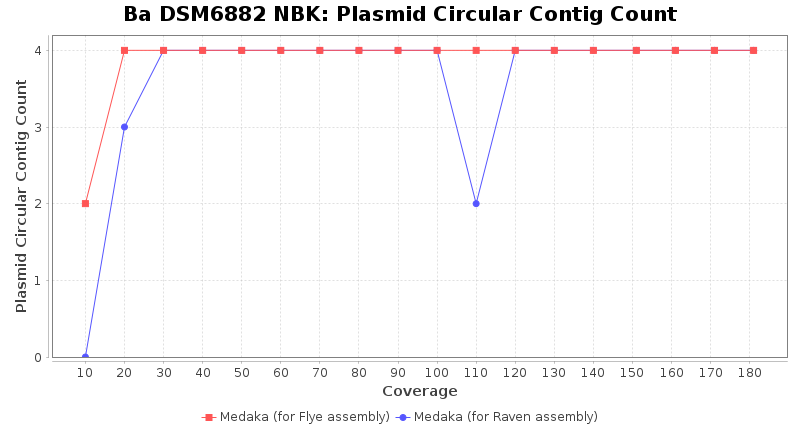
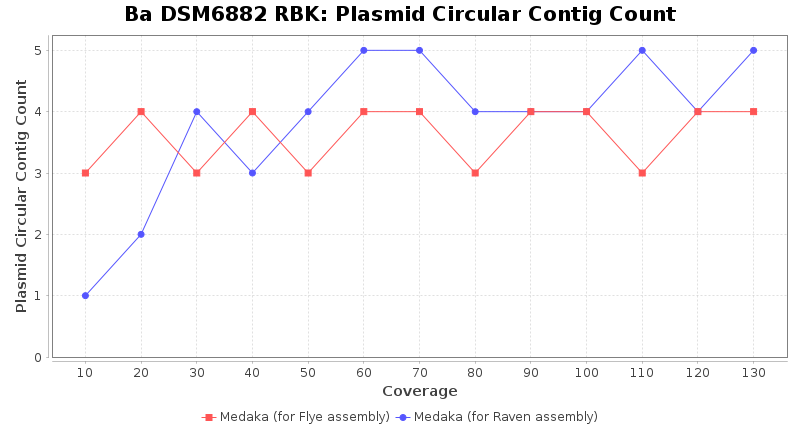
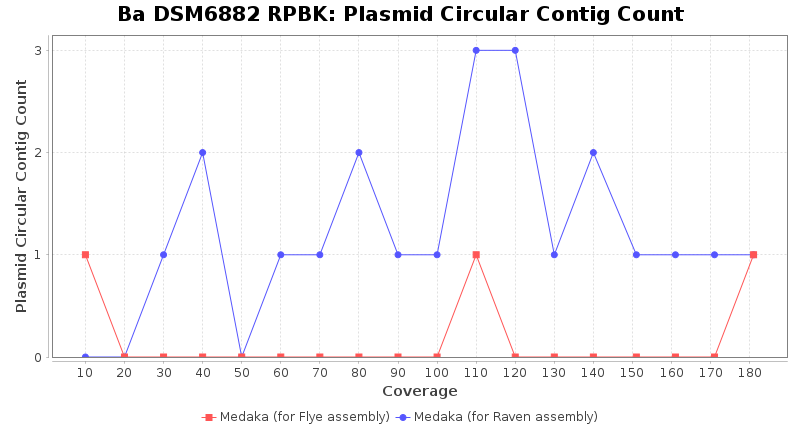
- Plasmid Circular Contig Count
- The number of contigs that were detected as circular and plasmid by MOB-recon
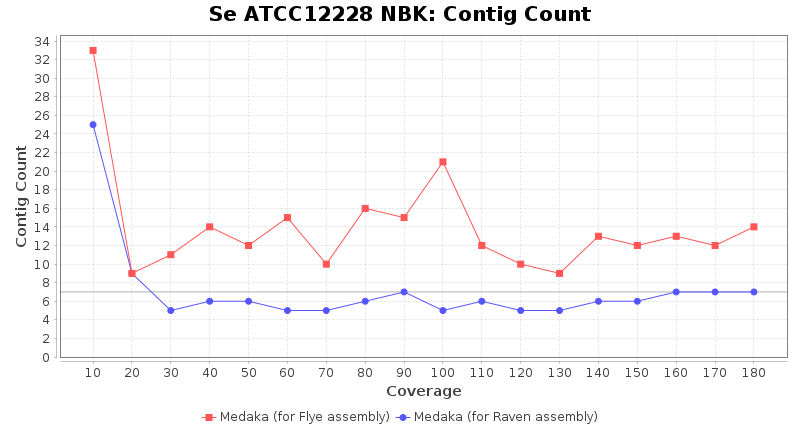
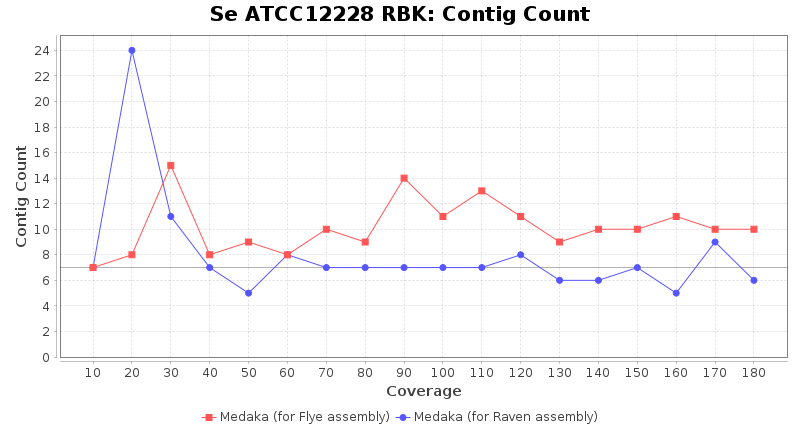
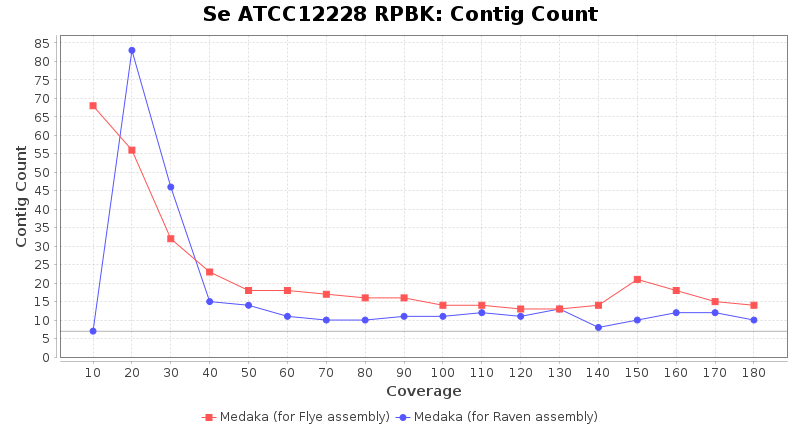
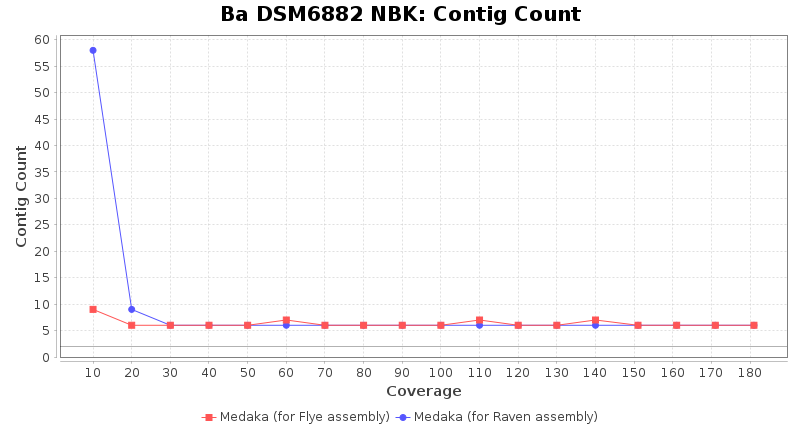
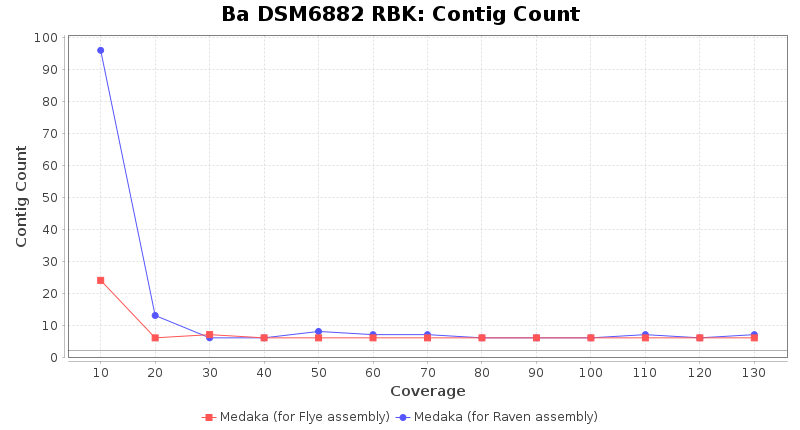
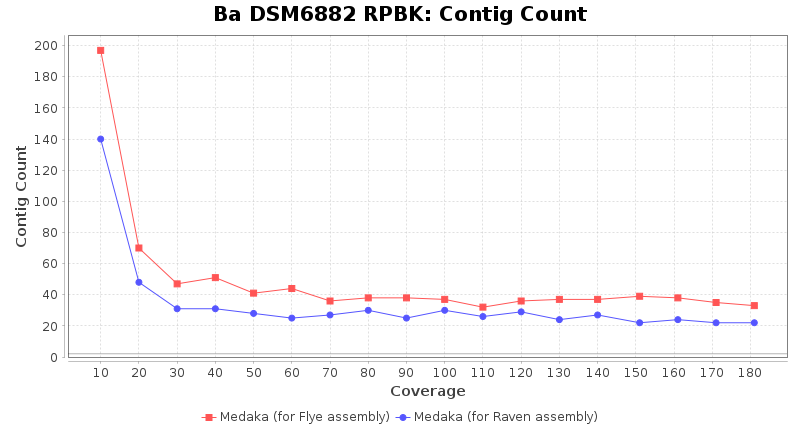
- Contig Count
- The total number of contigs
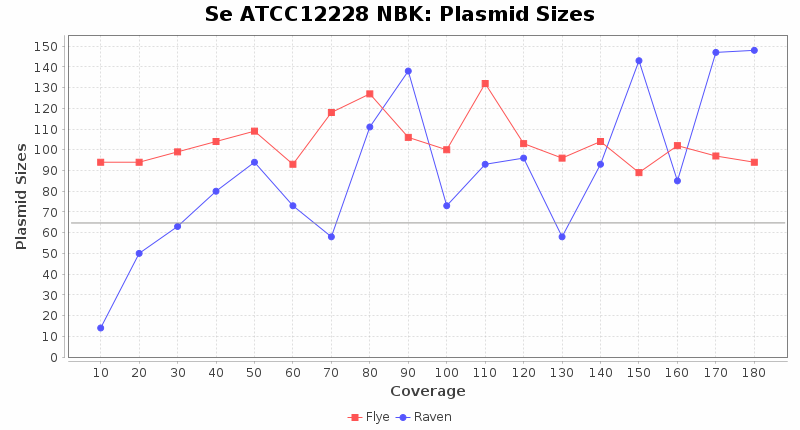
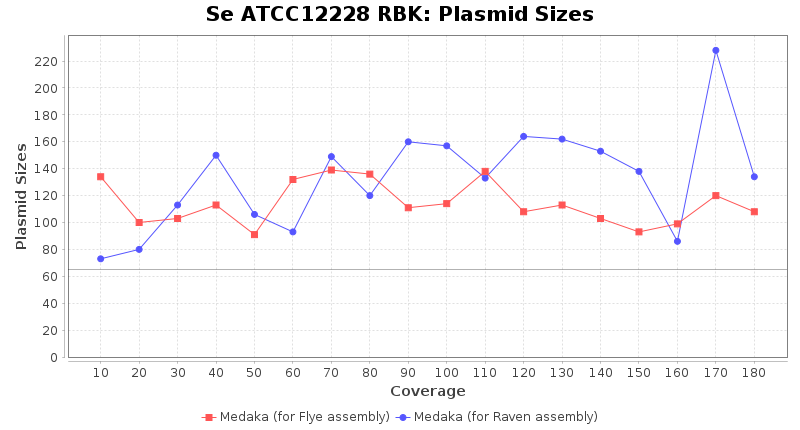
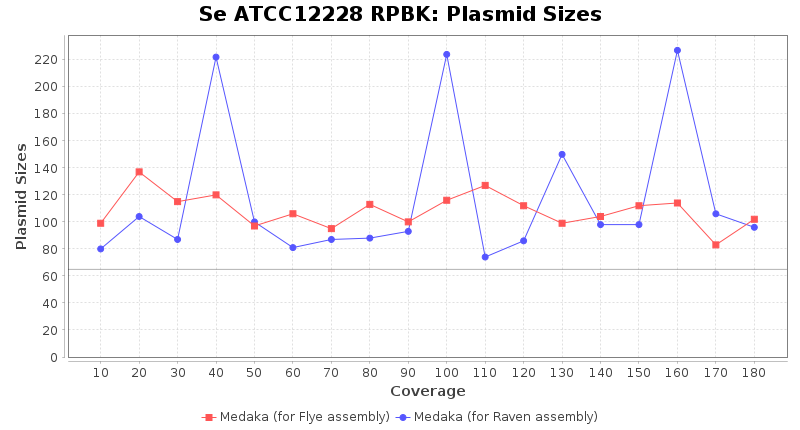
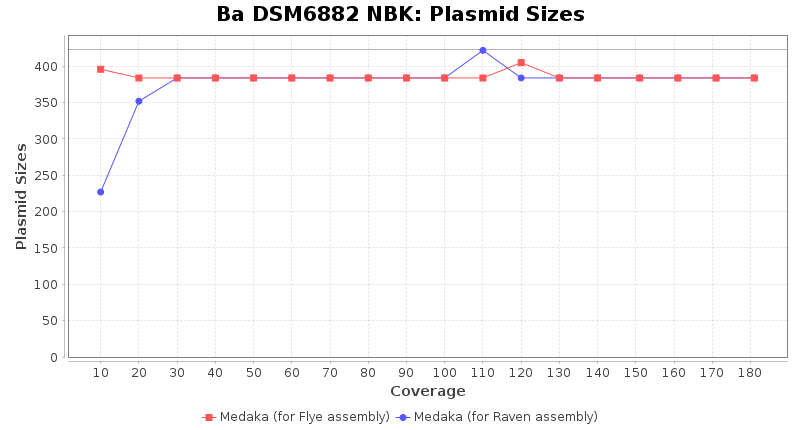
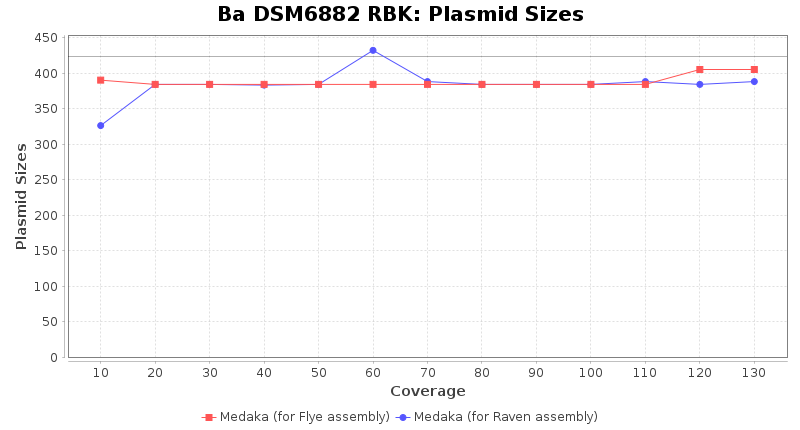
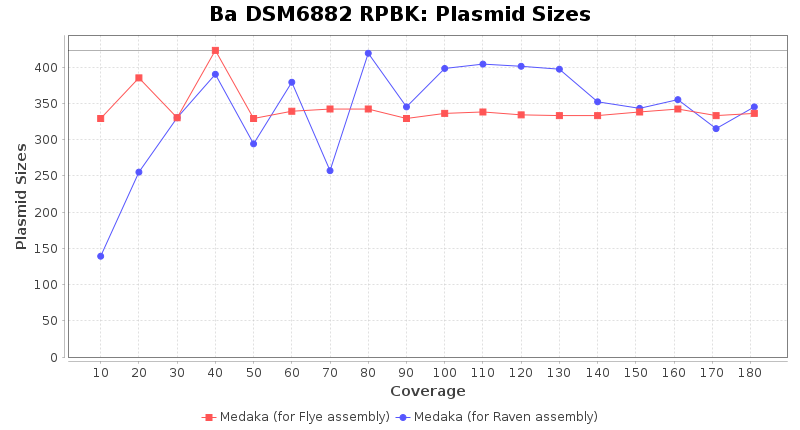
- Plasmid Sizes
- The total base count of all contigs that were detected as plasmid by MOB-recon
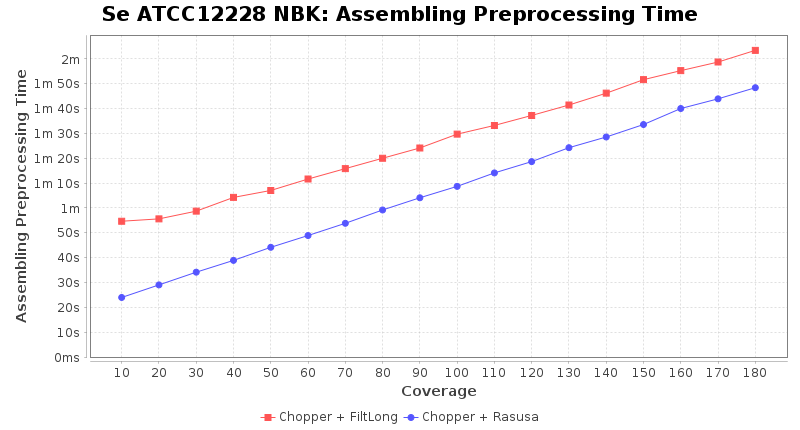
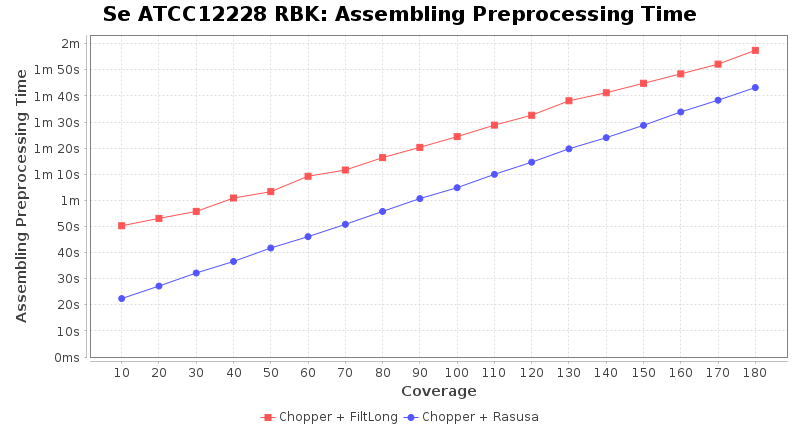
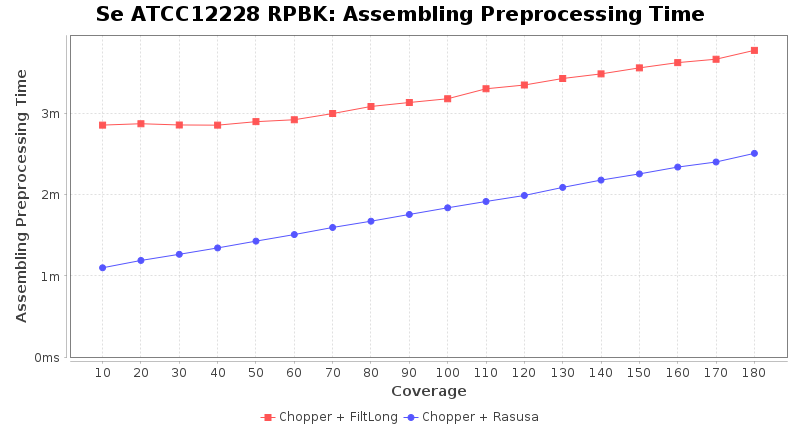
Preprocessing Performance (Chopper + Rasusa/FiltLong)
Assembling Results
Staphylococcus epidermidis ATCC 12228
| NCBI Accession | AE015929.1 |
| GC Content | 32 |
| Genome Size | 2.5 Mbases |
| Scheme Targets | 2146 |
| Chromosomes | 1 |
| Plasmids | 6 |
| Plasmid Sizes | 65.4 kb |
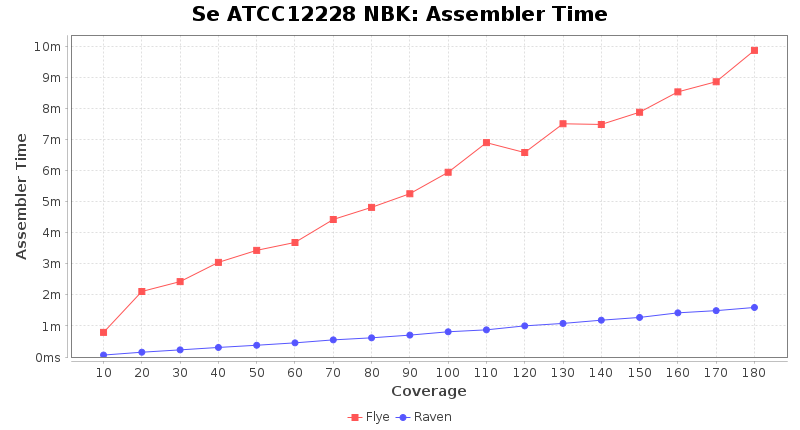
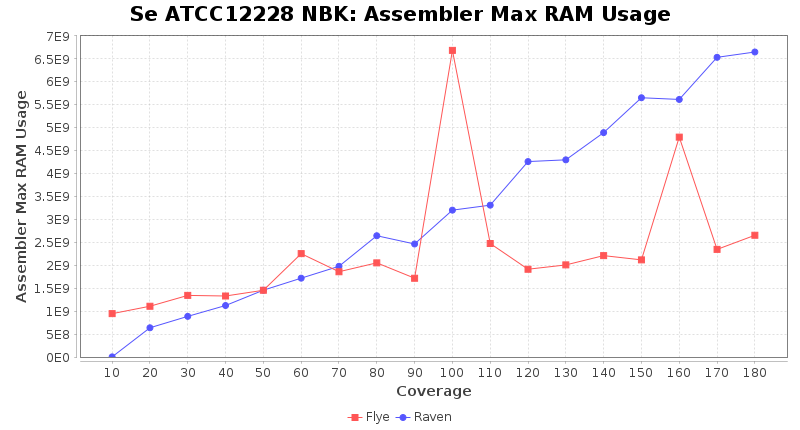
Staphylococcus epidermidis NBK
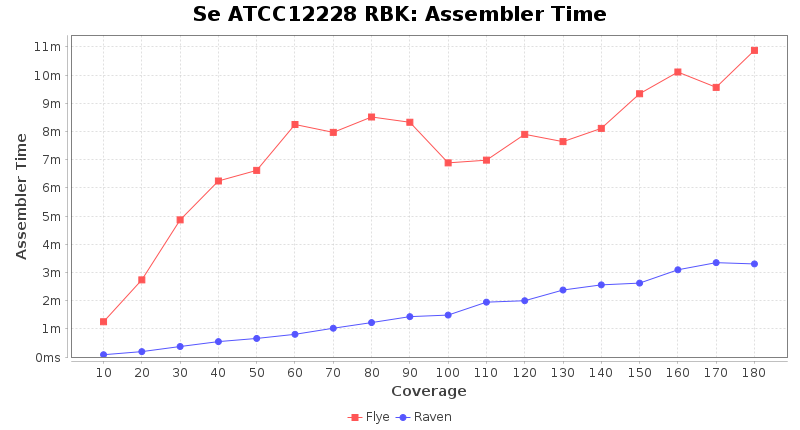
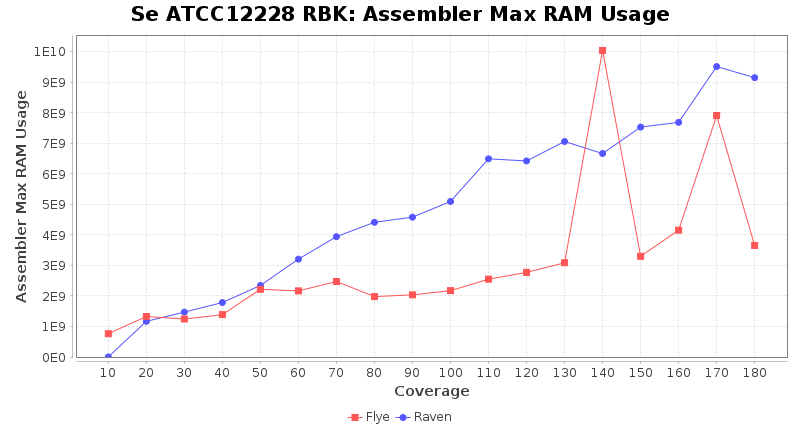
Staphylococcus epidermidis RBK
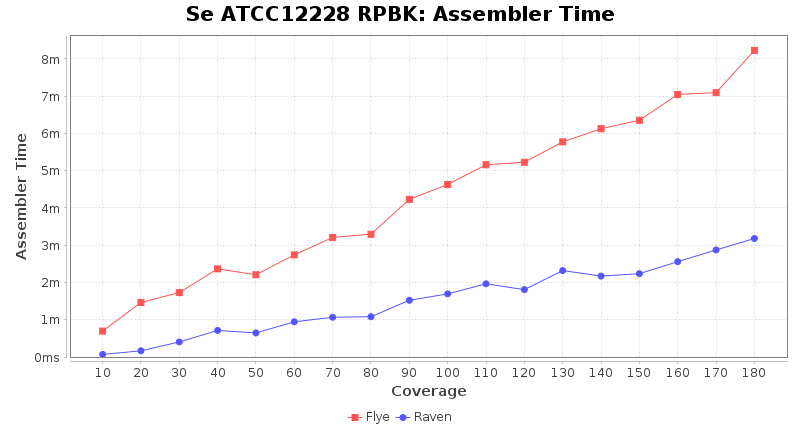
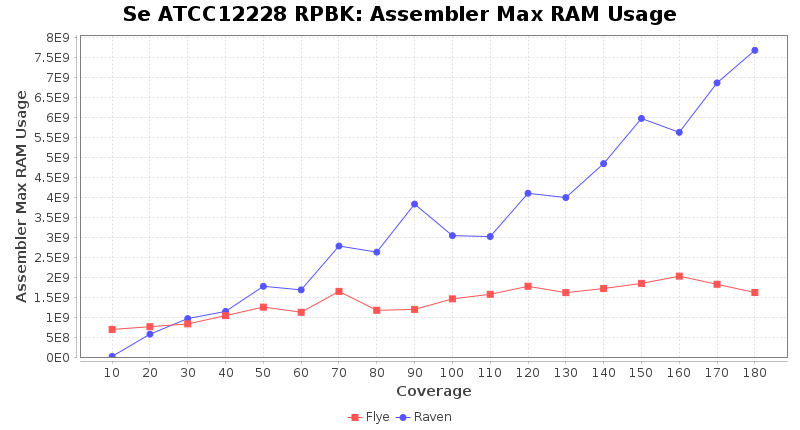
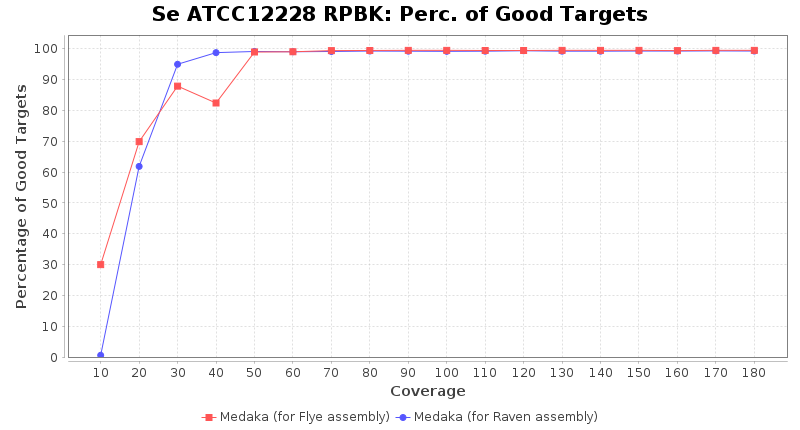
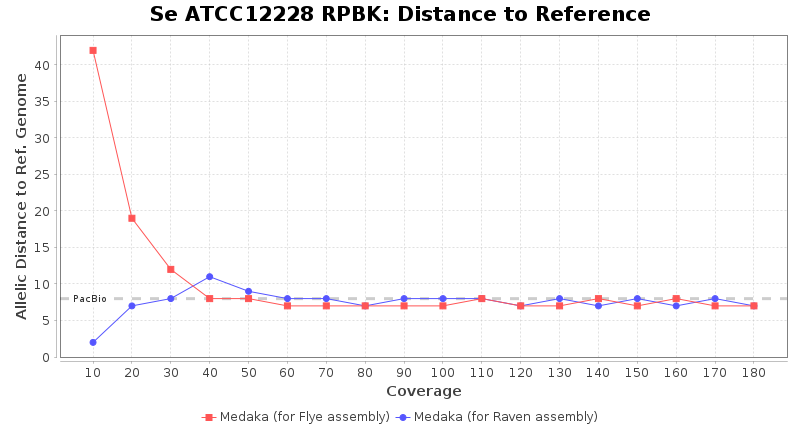
Staphylococcus epidermidis RPBK
Brucella anthropi ATCC 49188
| NCBI Accessions | NC_009667.1, NC_009668.1 |
|---|---|
| GC Content | 56 |
| Genome Size | 4.8 Mbases |
| Scheme Targets | 4229 |
| Chromosomes | 2 |
| Plasmids | 6 |
| Plasmid Sizes | 422.6 kbases |
Brucella anthropi NBK
Brucella anthropi RBK
Brucella anthropi RPBK
Postprocessing Performance (Medaka)
Summary
Downsampling with FiltLong takes somewhat longer than with Rasusa. Raven is considerable faster than Flye but usually requires somewhat more RAM. The error-rate (distance to reference) and retrieval of core genome genes (percentage of good cgMLST targets) is similar for both assemblers. However, with low coverage (<20x) Flye produces substantially more errors. Flye produces somewhat more circular contigs but Raven produces overall less contigs. Polishing of Raven assemblies is faster than polishing with Medaka Flye assemblies. When inspecting especially the results of 'Distance to Reference', 'Perc. of Good Targets', and 'Contig Count' starting from a coverage of about 50x the results remain mostly stable and optimal.
FOR RESEARCH USE ONLY. NOT FOR USE IN CLINICAL DIAGNOSTIC PROCEDURES.