

The Sample QC Statistic can be started using the menu command Tools | Sample QC Overview and using the Advanced option at the bottom of the dialog window.
The statistic will show the distribution of target QC results (not found/failed/succeeded) for multiple Samples. It can be calculated for Samples in the database. The statistics are calculated for each task template of the chosen samples, or for a single task template only, if this task template is selected in the database search criteria.
Additional Sample fields can be included into the QC statistic tables.
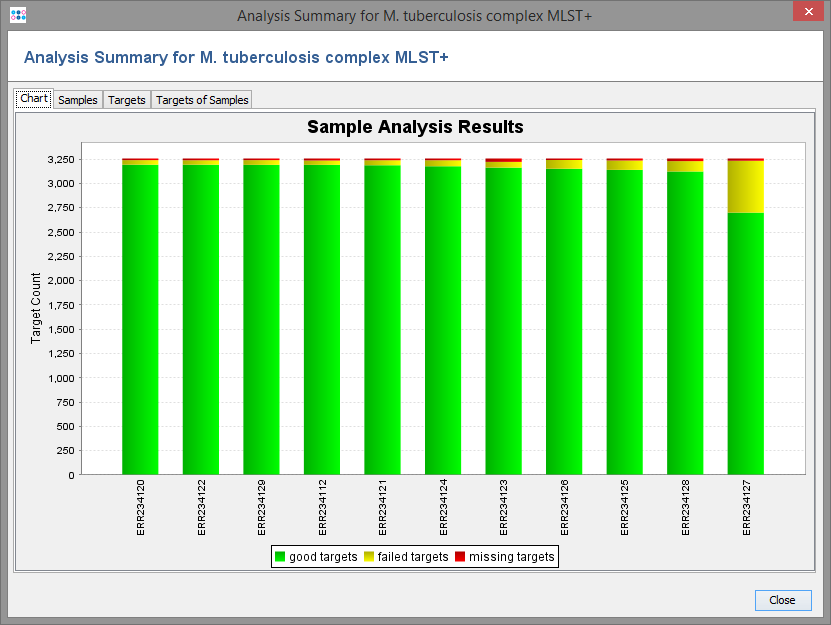
The basic summary contains a chart that shows color coded the distribution of tasks that
- were not found (grey)
- failed the analysis checks (red)
- succeeded (green)
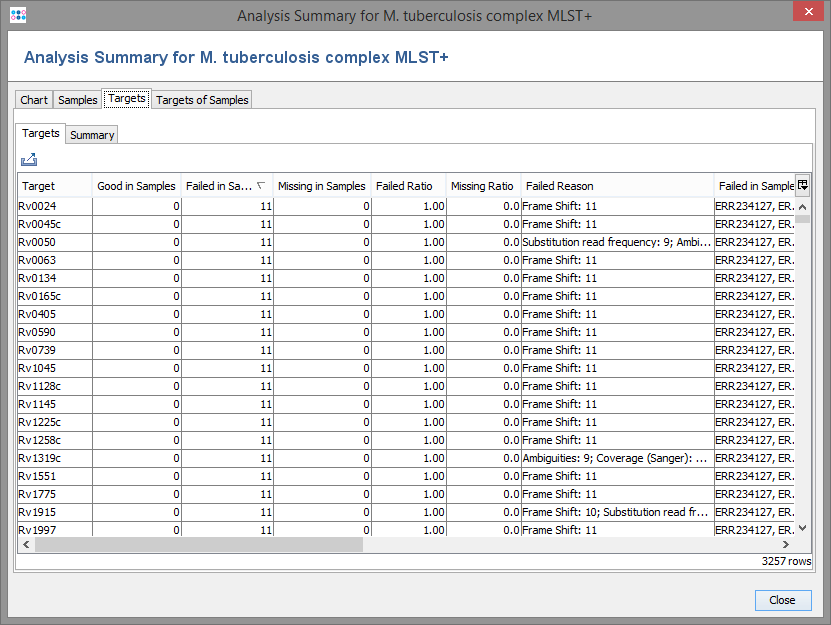
Tables that show the distribution of not found/failed/good targets per Sample and the results per target are also included. The column "Fail Reason" contains the distribution of the first analysis problems found.
Additionally, the following functions can be included in the calculation:
- Include Variant Statistics
- Adds statistics for all consensus variants to target ref.-seqs. (seed genome) that are found for each sample (time and memory consuming)
- Include Allelic Distance to Ref.-Seqs.
- Adds statistics for the allelic distance to the target ref.-seqs. (seed genome) for each sample.
- Include Statistics per Target
- Adds statistics for each target, to see how many samples failed or succeeded for them.
- Include Pipeline Performance Measures
- Adds the measured runtime and memory usage (if available) for samples that were processed in a pipeline.
FOR RESEARCH USE ONLY. NOT FOR USE IN CLINICAL DIAGNOSTIC PROCEDURES.