

Overview
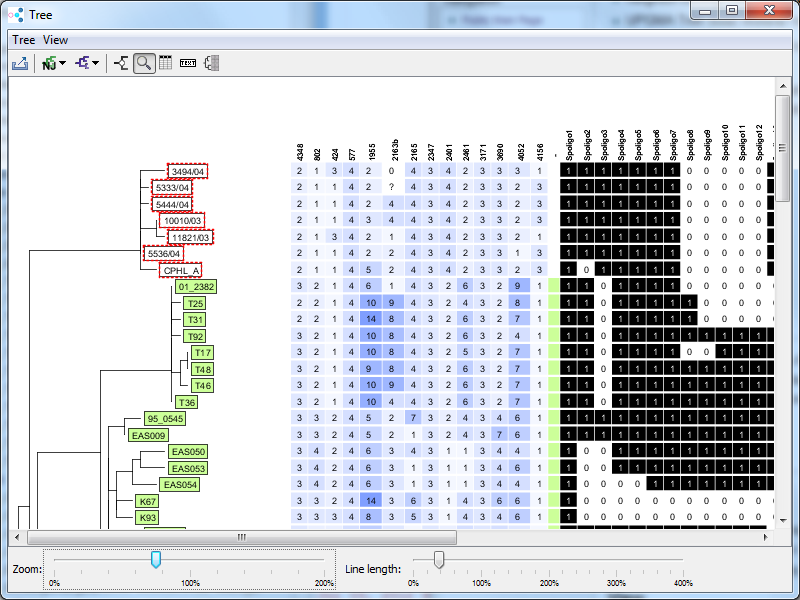
A phylogenetic tree can be calculated for the Samples of a Comparison Table. The tree is linked with the table. Any changes and selections in the table will update the tree.
Only one linked phylogenetic tree window can be opened for each comparison table. However, to make comparison of different trees or different settings possible, the window can be disconnected from the table, which allows to open another phylogenetic tree window.
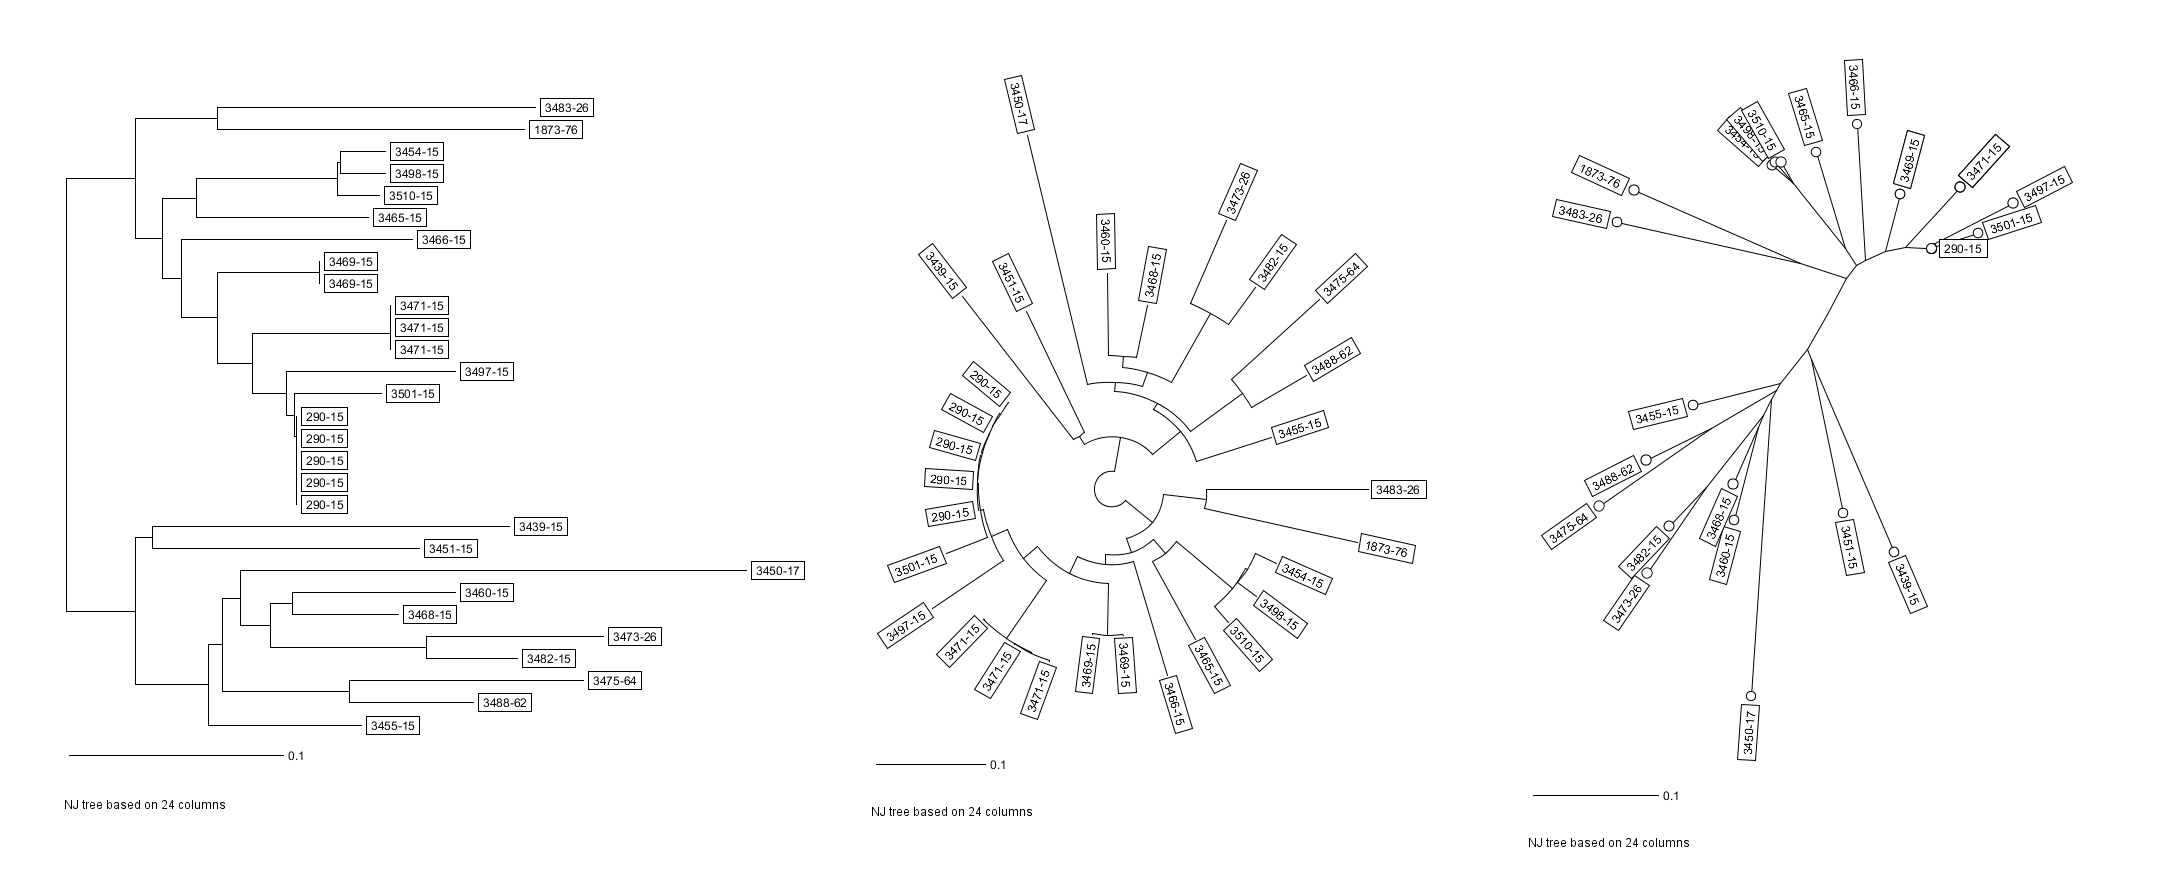
Trees can be displayed as three different types of graphs:
- a dendrogram or
- a circular tree or
- a radial tree
For the radial tree, the equal-daylight algorithm can be used to optimize the layout. (Felsenstein, 2004)
Two tree types are supported:
- Neighbor-Joining Tree (Saitou, Nei 1987)
- UPGMA Tree (Sokal, Michener 1958)
The Zoom Controls can be used to zoom the graphs or to increase the length of the lines. The trees can be exported in various formats.
To select Samples in the tree, either click each leaf or click an inner node to select all Samples in the subtree below the node. Hold the CTRL-key to select multiple Samples. Click on a Sample using the right mouse button to open a context menu.
Distance calculation
The tree is built using the values from the columns that are selected for distance calculation. If the columns used for distance calculation change, the tree is rebuilt (if the window is not disconnected from table).
Empty values or values that start with a ? are treated as missing values. Depending on the Distance Calculation Settings these missing values are either treated as an own category or ignored during pairwise comparison. The Distance Calculation Settings command can be used to change the settings.
For a lower number of columns for distance calculation, (e.g. for MLVA data or MLST data), the missing values are an own category option is recommended. For a larger number of columns (e.g. cgMLST with thousands of targets) the pairwise ignore missing values option is recommended.
| Note that the option pairwise ignore missing values may result in problems in the tree when a Sample contains many missing values. It is recommended to remove Samples that have missing values in more than 10% of the columns for distance calculation before calculating a tree. |
Menu
Tree
-
 Export Tree: Allows to export the tree and the graph in various formats:
- EMF: Exports a vector graphic image that can be easily inserted into PowerPoint or Word documents and can be resized without loss of quality.
- PNG: Exports a raster-image in the currently displayed resolution.
- SVG: Exports a vector graphic image that can be resized without loss of quality. The SVG-format is well suited for creating high-resolution graphics. See Image File Formats for more information.
- NWK: Newick Tree Format. Contains a textual representation of the tree that can be viewed by other programs, e.g. MEGA.
- On the right side of the output file chooser dialog it can be defined if the legend should be added to the exported image or not, or if the legend text should be exported into an extra image file.
-
 Copy Tree to Clipboard: Copies the tree to the clipboard as raster-image in PNG format.
- Copy Legend Groups to Clipboard: Copies the color groups of the legend to the clipboard as raster-image in PNG format.
- Copy Legend Comments to Clipboard: Copies the comment lines of the legend to the clipboard as plain text.
-
 NJ-Tree: Display a NJ-tree.
-
 UPGMA-Tree: Display an UPGMA-tree.
- Distance Calculation Settngs: Change the settings for the distance calculation of the tree.
-
 Disconnect Tree from Table: Changes in the table will not update the tree any more. Opening a new tree window is possible after disconnecting. This option can be used to compare trees for different data or settings. Note that the label text cannot be changed after the tree is disconnected and that additional data is removed from the tree.
View
-
 Dendrogram View: Displays the tree as a dendrogram.
-
 Circular View: Displays the tree as circular graph.
-
 Radial View: Displays the tree as radial graph.
- Radial (equal-daylight) View: Displays the tree as radial graph using the equal-daylight algorithm.
-
 Show Zoom Controls: Toggles the visibility of the zoom controls for zoom and line length.
-
 View Options: Opens a dialog window that allows to customize how the tree is displayed. The font and color of the labels can be selected and it is possible to specify if boxes should be drawn around labels.
- Show distance matrix: Opens a window with the distance matrix that was used for building the tree and allows to export this distance matrix in MEGA or NEXUS format (e.g. for use with the SplitsTree software).
-
 Choose Columns for Label: Select the columns that are used for the tree labels. More than one column can be selected, the values are then separated by ','
-
 Add Data to Tree: Choose columns that are included as additional data into the tree image. See Add Data to Tree.
- Sort by Selected Nodes: If checked, the nodes that are selected in the tree window are sorted to the top of the Comparison Table.
The context menu can be opened by right-clicking a tree node. It contains the following commands:
-
 Reroot Tree: Sets the new root of the tree above the selected tree node.
-
 Rotate Subtree: Only available when an inner node was clicked. Rotates the subtree below the node.
-
 Add to Exclude List: Add the selected Samples to the exclude list.
- Set Group: Allows the set the group for the selected Samples.
References
- Felsenstein, J., Inferring Phylogenies, Sinauer Assoc., 2004,
- Nei, M., F. Tajima, & Y. Tateno Accuracy of estimated phylogenetic trees from molecular data. II. Gene frequency data. J Mol Evol 1983, 19:153-170.
- Saitou N, Nei M. The neighbor-joining method: a new method for reconstructing phylogenetic trees. Mol Biol Evol 1987, 4:406
- Sokal R, Michener C. A statistical method for evaluating systematic relationships. Univ Kansas Sci Bull 1958, 38:1409–1438.
FOR RESEARCH USE ONLY. NOT FOR USE IN CLINICAL DIAGNOSTIC PROCEDURES.