

When multiple Samples are located at the same position, they can be displayed using three different modes on the map:
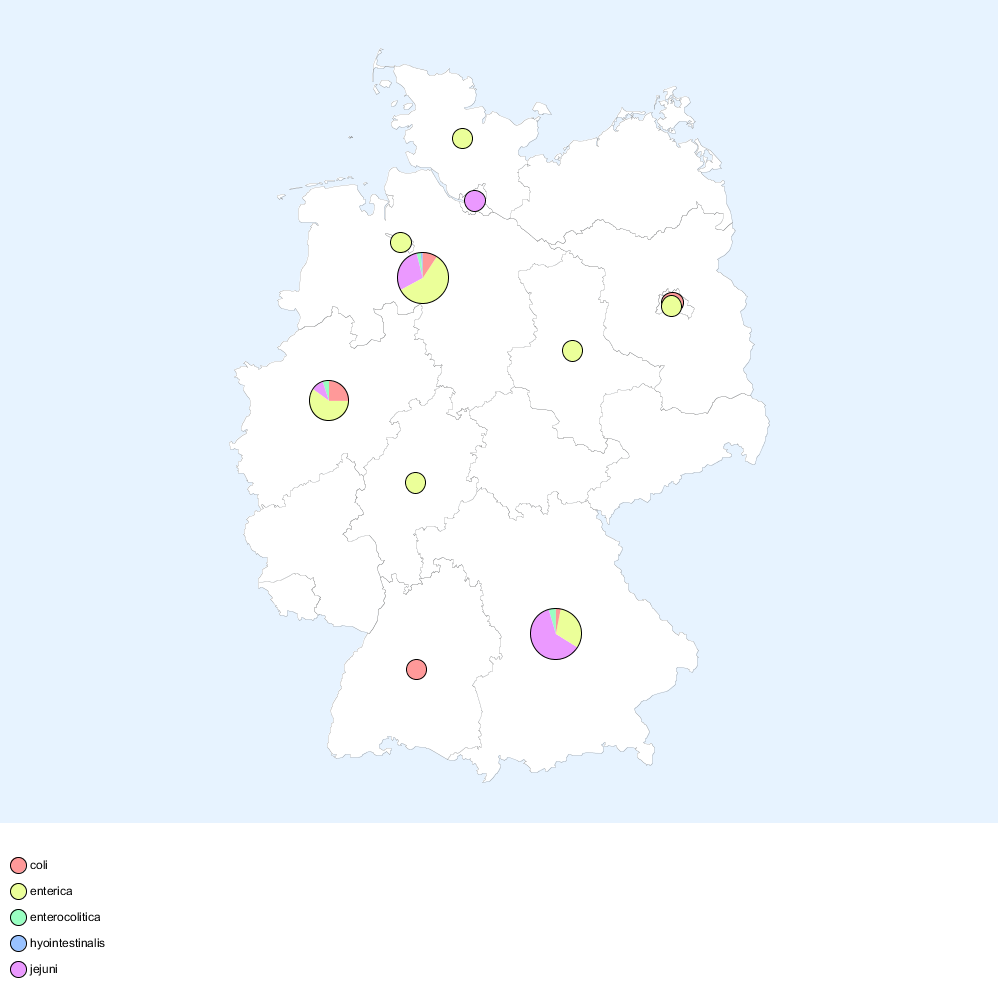
- as pie-chart, where the pies are filled with the group colors
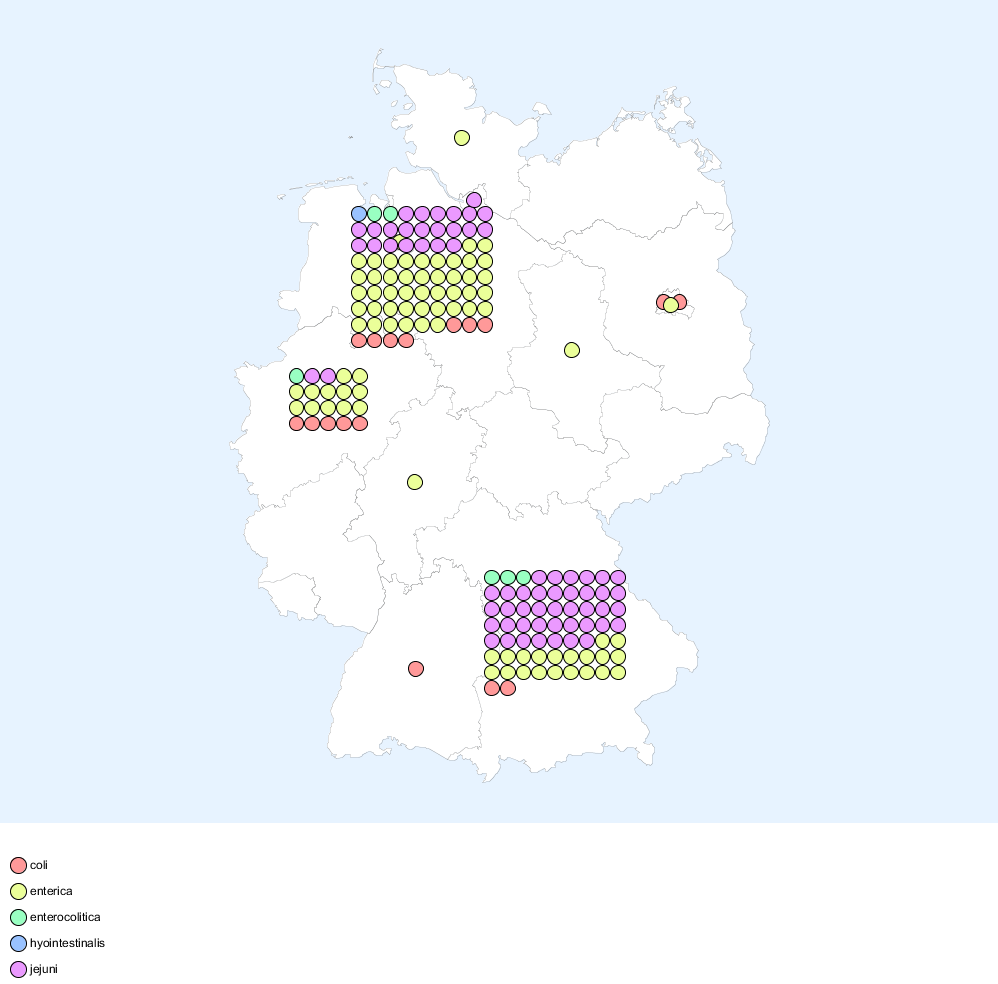
- as small circles, where multiple circles are drawn filled with the corresponding group colors
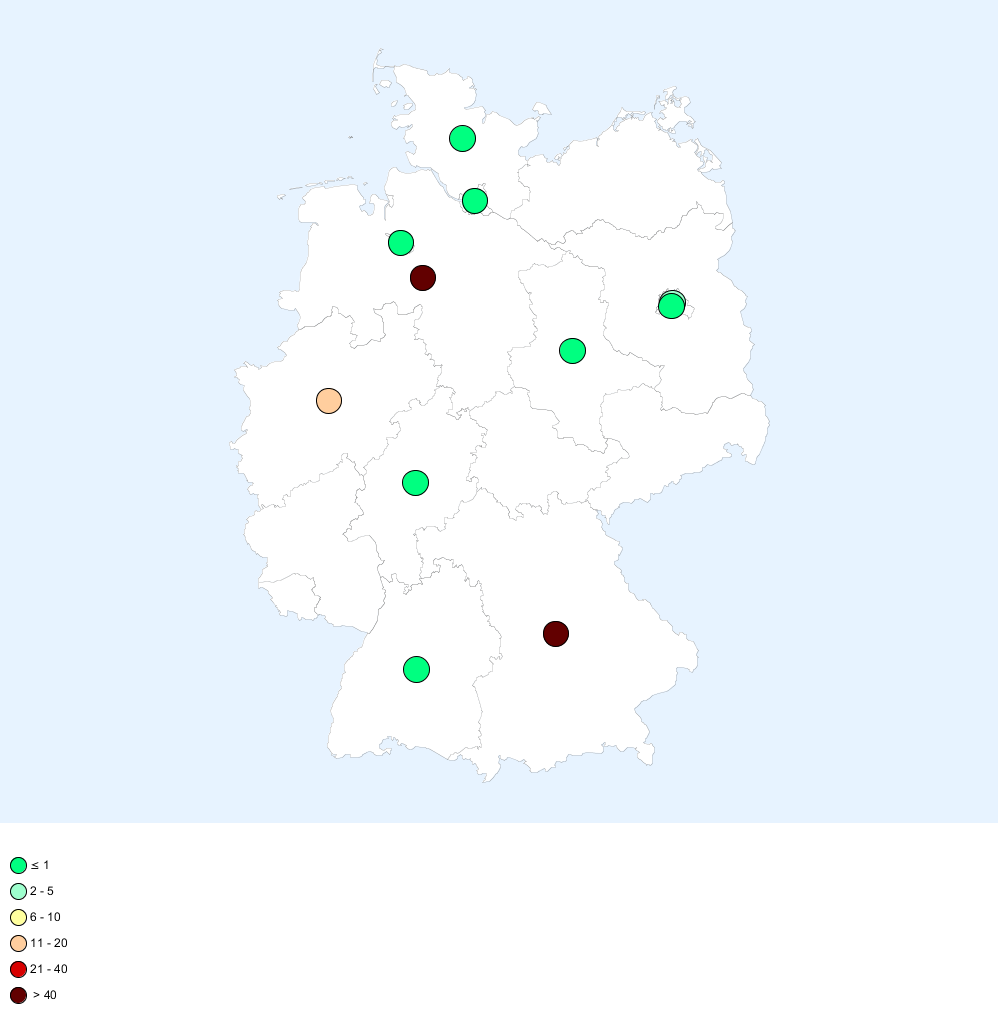
- by Sample count, where the color represents the number of Samples that share the same position
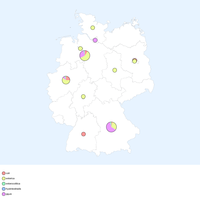
as pie-chart

as small circles
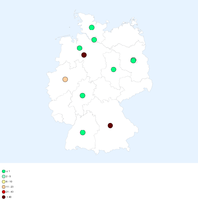
by Sample count
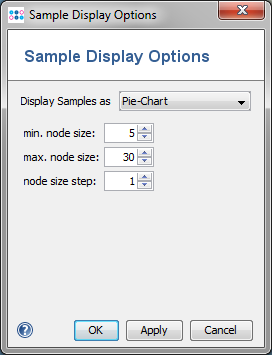
The Sample Display Options dialog can be used to switch between these modes.
For the pie-chart, there are additional options:
- min. node size: the minimum size of a pie
- max. node size: the maximum size of a pie
- node size step: the amount a pie gets larger for each Sample at the position
For the Sample count mode, the colors and thresholds can be defined.
FOR RESEARCH USE ONLY. NOT FOR USE IN CLINICAL DIAGNOSTIC PROCEDURES.