

Contents
1 Overview
This tutorial describes how to use the Ridom Typer software to analyze Sanger sequence data (e.g., chromatogram files) with Multi Locus Sequence Typing (MLST).
Furthermore, it is explained how to create a Task Template for automated sequence analysis. The MLST scheme for N. meningitidis is used as an example for demonstration purposes. However, by reading this tutorial you should be able to define your own MLST templates for other species.
![]() Hint: For retrieving the newest MLST profiles for your own sequence data, a registration at PubMLST.org is required.
Hint: For retrieving the newest MLST profiles for your own sequence data, a registration at PubMLST.org is required.
2 Preliminaries
- Step 1: This tutorial requires a running Ridom Typer client and server. Start the Ridom Typer server, then start the Ridom Typer client and initialize the database. For evaluation purpose a free evaluation license can be requested.
- Step 2: Download the example data archive Ridom_Typer_Examples_Sanger_N_meningitidis_MLST.zip for this tutorial, and extract the zip-file on your computer. The example data contains Sanger/CE sequencing data for Neisseria meningitidis MLST of 3 samples of a community outbreak that was published by U. Vogel et al. (J. Clin. Microbiol. 50: 1889, 2012).
3 Creating Project with Epi Database Scheme and Task Template
- Step 1: Create a new Project for use with your sample data with the menu: File | New | Create Project
- Step 2: Enter a name in the field Project Name (e.g., Neisseria MLST Sanger). The fields Category and Acronym can be left empty.
- Step 3: Each Project within Ridom Typer needs to have at least one Task Template associated. Press
 Add in Task Templates section.
- Step 4: The dialog window Add Task Template to Project opens. Press the button
 Create New
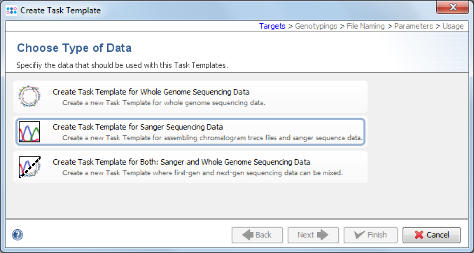
- Step 5: Choose Create Task Template for Sanger Sequencing Data.
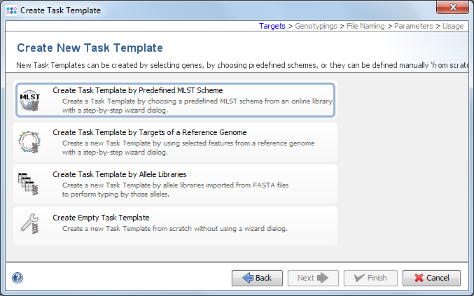
- Step 6: Now choose Create Task Template by Predefined MLST Scheme.
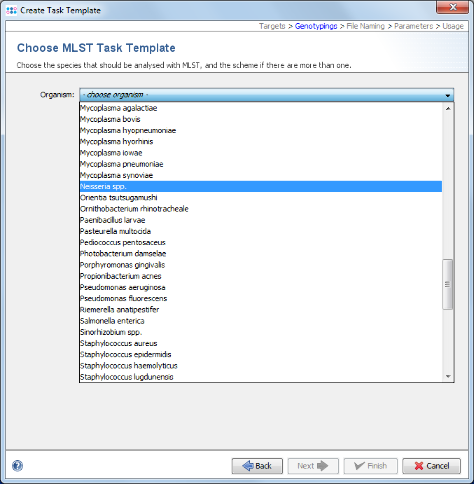
- Step 7: Choose in the organism the entry Neisseria spp. and the data will be downloaded from the public MLST server.
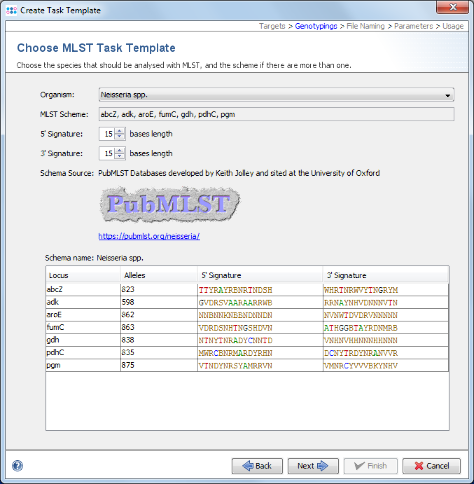
- Step 8: Once downloaded click Next to continue.
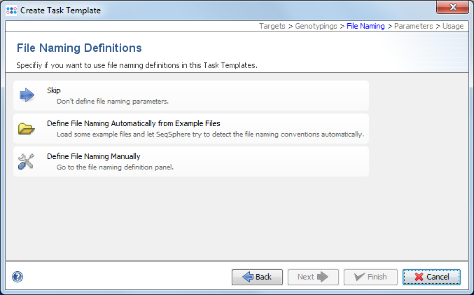
- Step 9: Now choose Define File naming Automatically from Example Files.
- Step 10: The definition of the file naming is important to enable a batch processing of sequence files. Press the
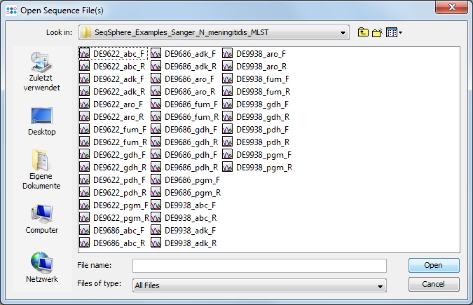
 Add Example Files button, and select all scf-files from the tutorial example data directory and confirm with Open. Then press Next to continue.
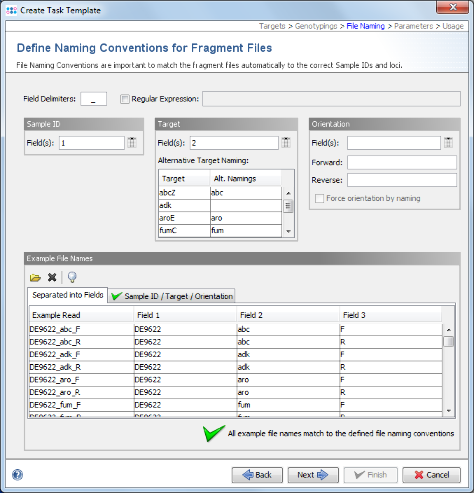
- Step 11: Ridom Typer tries to guess the file naming from the example files. The green
 on the bottom marks that a file naming was found that matches to all example files. If the file naming is not detected automatically, the Sample ID and target parts of the file name must be configured manually. For the example data it is detected automatically. Click Next to continue.
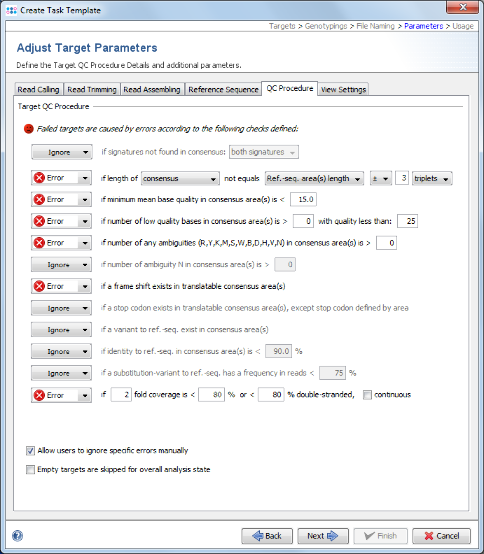
- Step 12: This step shows the Target Parameters for the Task Template (e.g., the quality check parameters). They can be left unchanged. Click Next.
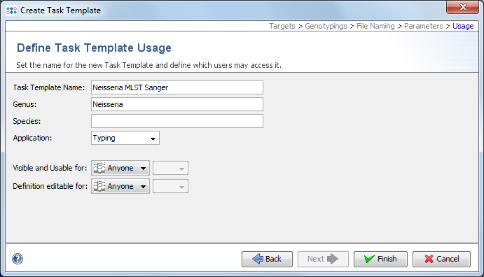
- Step 13: Check the name of your new Task Template, and confirm with Finish. Press OK to save the new Task Template and add it to your Project.
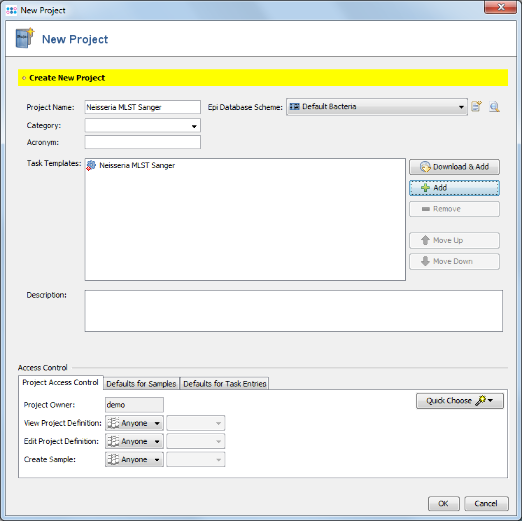
- Step 14: In the top row of the Project window the Epi Database Scheme can be selected. This defines the database fields that are available for this Project. For a new Project the Epi Database Scheme Default Bacteria is preselected. Press the
 button on the right to see the details.
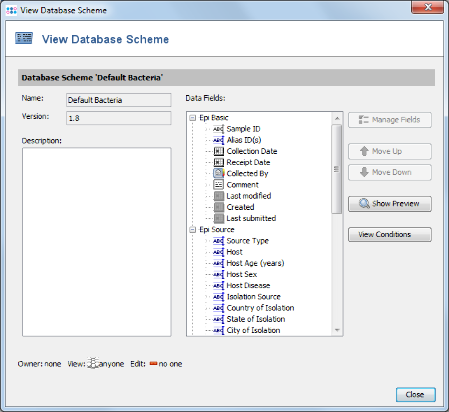
- Step 15: This scheme contains already all fields that are normally needed and is compliant with the NCBI BioSample fields. New fields can be added by creating a new Database Scheme that extends the default one. For this tutorial the Database Scheme is left to default therefore Close the window. Then save your Project by confirming with OK.
- Ridom Typer is a resequencing software. Once you have setup a project like this you can literally analyze hundreds/thousands of sequence data automatically.
4 Importing the Sequence Data
- Step 1: Choose from the menu File | Process Sanger Sequencing Data
- Step 2: Press the
 button above the file browser panel on the left, and choose the directory where you extracted the tutorial example data.
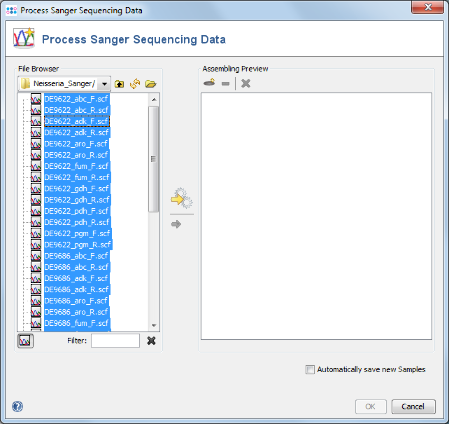
- Step 3: Select the tutorial example data directory or all of the scf-files in it, and press the button
 (Hint: Use CTRL+A to select all files in the directory).
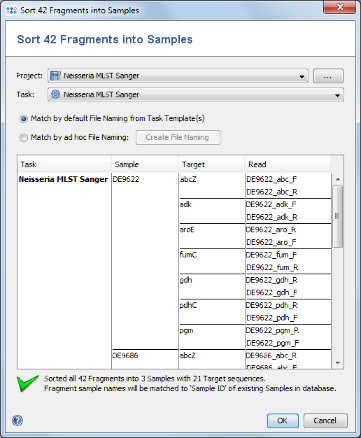
- Step 4: In the upcoming preview dialog select the Project that was just created. The files are now sorted corresponding to the file naming defined above. Each Sample has 7 targets, and each target has 2 chromatograms. Press OK to confirm the preview dialog.
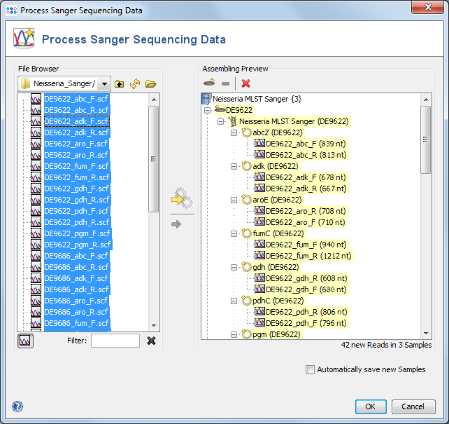
- Step 5: The 42 reads are now sorted into 3 Samples listed in the tree on the right. Each Sample has an MLST Task Entry with 7 targets, one for each locus. Press OK to confirm the dialog and start the assembling.
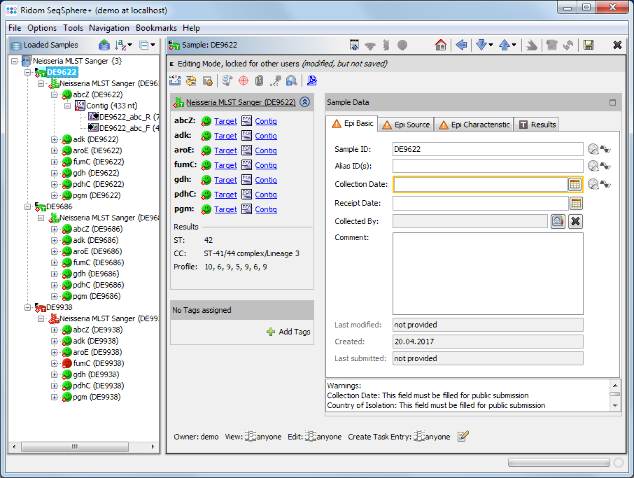
- Step 6: The 3 Samples are now assembled one after the other. They are listed on the navigation tree in the left of the main window. Double-click on the Task Entry item
 Neisseria MLST Sanger (DE9622) in the navigation tree of the first Sample DE9622.
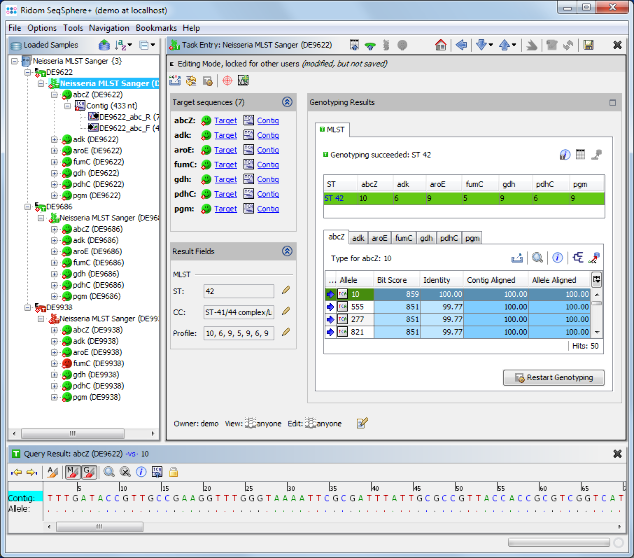
- Step 7: The MLST results are shown in the right panel of the main window. The combination of the 7 MLST loci of this Sample corresponds to sequence type (ST) 42.
- Step 8: 2 of the 3 Samples have green icons (
 ), which means that the target QC procedure succeeds for all 7 MLST loci. But Sample D9938 has a red icon (
 ) because target fumC of this Sample has failed in the target QC procedure. Double click on the red target icon
  of target fumC in Sample D9938 to see the details.
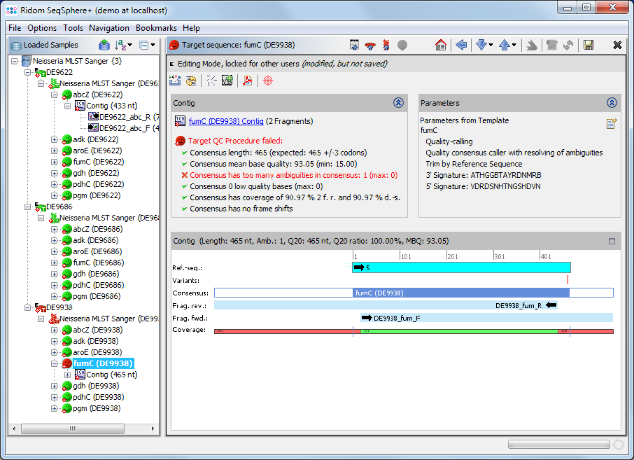
- Step 9: As shown in the warning message on the right, target fumC of this Sample has failed because of too many ambiguities. Click on the Contig link above the warning messange to navigate to the contig level.
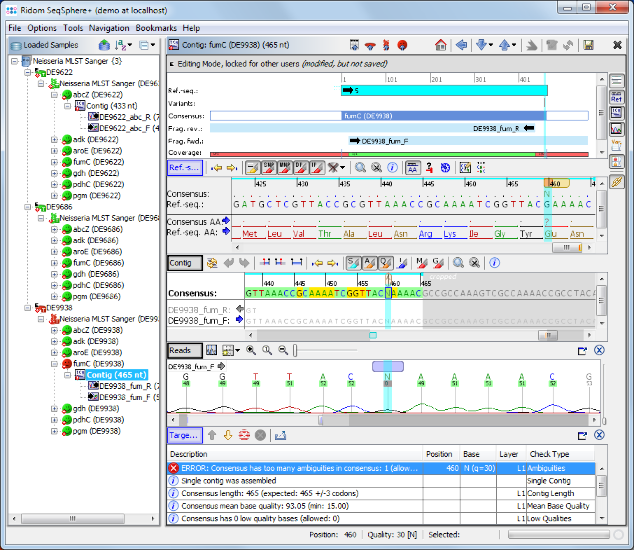
- Step 10: Click in the Target QC Procedure pane on the row with the error and the cursor jumps to the problematic area where an ambiguity symbol N can be seen in the read data. This is a wrong base-call in the chromatogram. Obviously the correct base on this position should be a G. Press the G on your keyboard to substitute the ambiguity N with a G base.
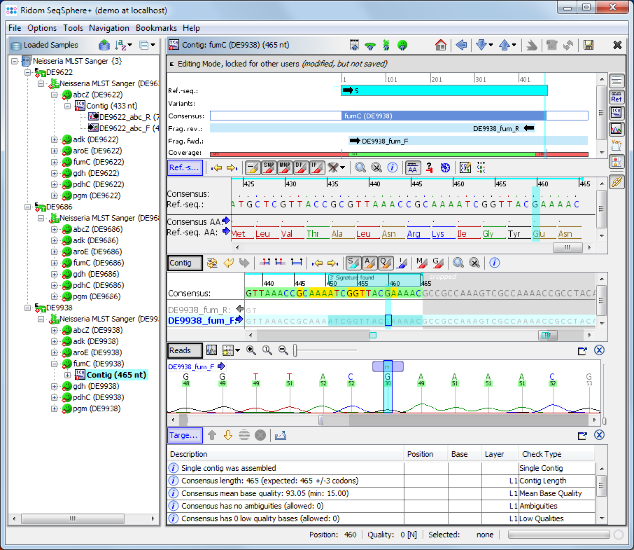
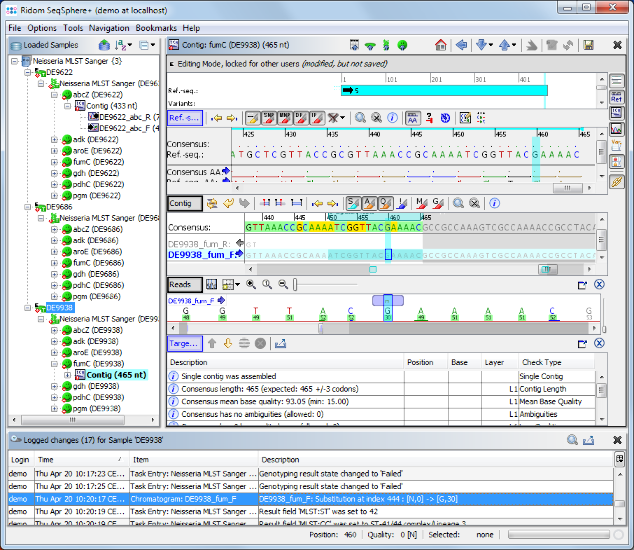
- Step 11: The target QC procedure is automatically updated. The Sample D9938 has now a green icon (), all targets have succeeded. All edits are logged in an audit trail. Right-click on the Sample node in the navigation tree, and select
 Show Sample Audit Trail. A new panel appears on the bottom of the main window, listing the history of the Sample entry with detailed information about all edits (who, when, and what).
5 Store and Retrieve Samples
- Step 1: Choose from the menu
 File | Save All to store the 3 Samples to the database on your Ridom Typer server.
- Step 2: Choose File | Close All to remove them from the workspace
- Step 3: Choose
 File | Search Samples. Select the Neisseria MLST Sanger project in the Project box, and choose 1 days for Recently modified. Then press the Search button.
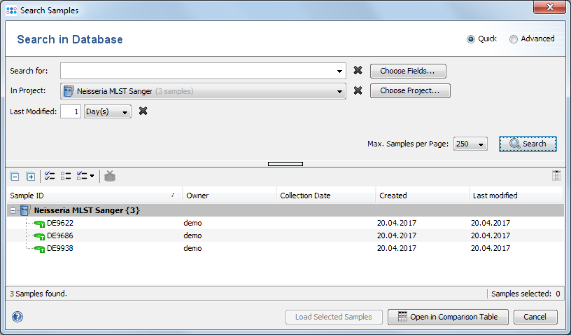
- Step 4: The 3 Samples that just were saved are listed. Now select the Advanced radio button in the upper right corner of the window.
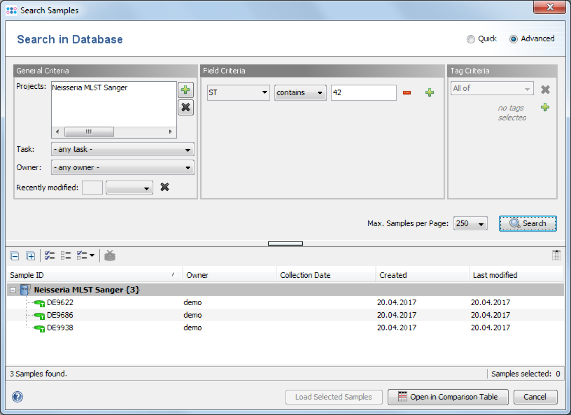
- Step 5: The window now shows the advanced search mask that can be used to search in specific fields (e.g., 'Neisseria MLST Sanger' ST = 42). Close the window by pressing the Cancel button.
6 Analyzing the MLST Results
- Step 1: Choose from the menu
 Tools | Comparison Table to perform phylogenetic analysis.
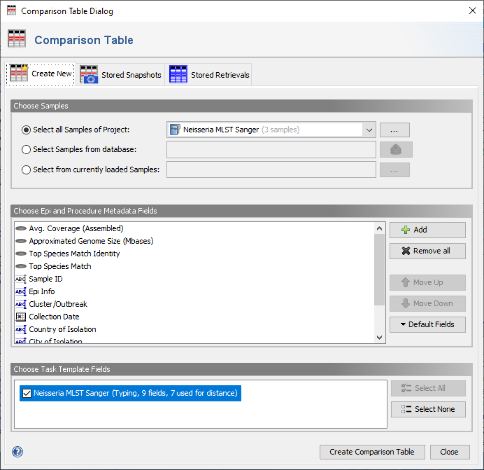
- Step 2: in the Comparison Table dialog go to the first tab "Create New". In the Choose Samples section select the project Neisseria MLST Sanger (should be preselected). Then select MLST in the Choose Genotypings Schemes section at the bottom. Press the Create Comparison Table button to confirm.
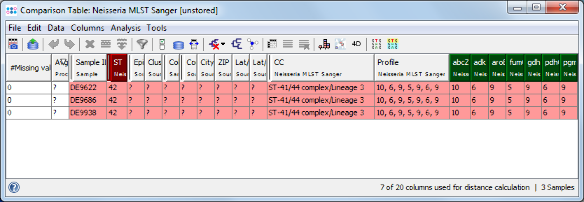
- Step 3: The comparison table window opens, showing the ST, some epi metadata fields, the clonal complex (CC), and the 7 allele types of the 3 Samples. The table rows are by default colored by the ST. The comparison table can be used to create phylogenetic trees (neighbor-joining or UPGMA), to export the distance matrix for further usage (e.g., for SplitsTree), or to create minimum spanning trees. Press the
 Minimum Spanning Tree button in the toolbar to calculate and draw a minimum spanning tree for the 3 Samples.
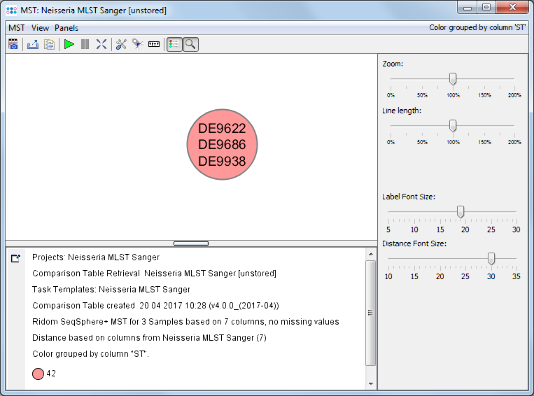
- Step 4: The minimum spanning tree window is opened. All 3 Samples collapse to a single node, because all have the same ST 42.