
| wiki | search |
This page describes how to reproduce the data for the bar chart diagram (Figure 1a) of the E. coli Sakai strain obtained by de novo assembling (MIRA) of the 454 GSJ, MiSeq, and PGM runs with Ridom SeqSphere+.
Requirements: Windows 7 64bit, with at least 6 GB RAM.
Installation and Start Up
- Step 1: Download the SeqSphere+ client and the SeqSphere+ server software and install both on your local computer.
- Step 2: Start Ridom SeqSphere+ server
- Step 3: Start Ridom SeqSphere+ client and login to the local SeqSphere+ server with username demo and password demo.
Quick Tour: Reproduce with Predefined Data
- Step 1: In the SeqSphere+ menu invoke SeqSphere+ menu function Tools | Create Sample Statistic Summary. A dialog window opens.
- Step 2: In the Project section press
 and add the project E.coli NGS Compare predefined.
- Step 3: In the Task section below choose the task template Ref Sakai 4671 genes corrected. Press OK.
- Step 4: After the calculating has finished, a result window with four different tabs opened. The first two tab shows a bar chart for the analysis results of the 7 samples sorted by the highest number of targets that had good analysis (green). The second tab shows the numeric details for each of the 7 samples. The other tabs can be ignored here.
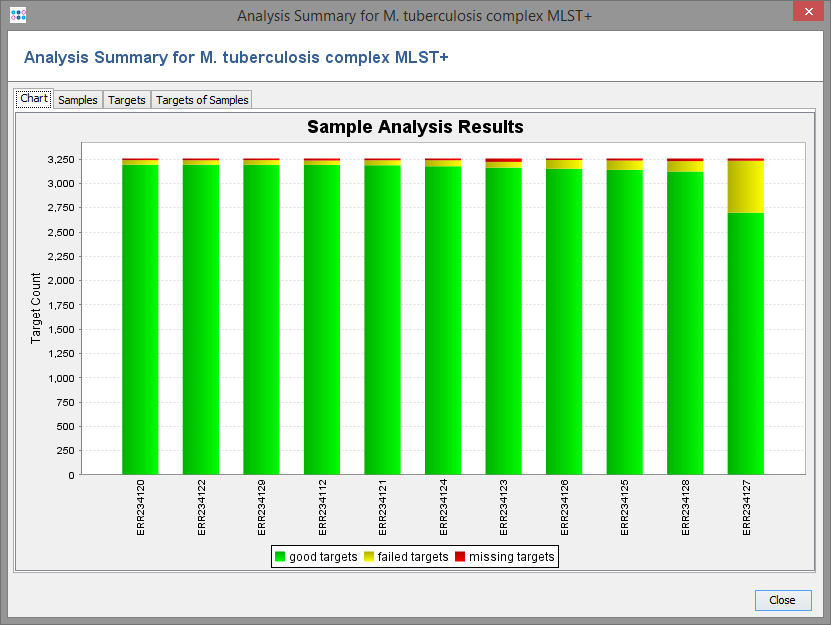
Failed targets (yellow): >97% but <100% identity and overlap to the corrected NCBI sakai
Missing argets (red): <97% identity and overlap to the corrected NCBI sakai
Extensive Tour: Reproduce with New Data
- Step 1: Importing data to the NGS Compare demonstration server requires an evaluation license. Click on the
 on the upper right toolbar of the SeqSphere+ window. If the home page of the server displays a warning level, click on the link Request or Activate a License and request a trial license.
- Step 2: Go to the ngscomparison ftp site and download the zipped de-novo assembly files to your computer. SeqSphere+ can read the zip-files so you don't need to extract them.
- Step 3: In the SeqSphere+ menu invoke the menu function File | Create Samples from Assembled Genomes
- Step 4: Select the Project E.coli NGS Compare empty.
- Step 5: Press the Add Task button and add both task templates of this project.
- Step 6: Use the button Add from File to open a file choosing dialog, and select the downloaded assembly files. After confirming, the files should appear in the table below Input Sequence Data.
- Step 7: Press OK to start the scanning for the gene Sakai reference sequences. This process will take several minutes (about 30 minutes on a Core i7).
- Step 8: After the scanning has finished, a dialog window opens that shows a table with the found targets for each of the assembly files. Press Create/Extend Samples to continue importing and analyzing the matching targets into SeqSphere+. This process will take several minutes (about 30 minutes on a Core i7 and memory setting 8 GB).
- Step 9: After the import has finished, the Position Navigator window opens. It contains lists of found problems and possible sequencing errors (e.g., homopolymer related InDels) for the last imported Sample. You can click on a row of a table to jump to the corresponding position in the contig alignment.
- Step 10: Now use the SeqSphere+ menu function Tools | Create Sample Statistic Summary.
- Step 11: Press the button Workspace.
- Step 12: In the next dialog, the 7 Samples that were newly imported should be selected already. Then press OK.
- Step 13: Choose the Task Template Ref Sakai 4671 genes correctedand press OK to start the calculation.
- Step 14: After the calculating has finished, a result window with 4 tabs opened. The first two tab show analysis for the 7 samples.