| wiki | search |
The Sample Analysis Summary can be started using the menu command ![]() Tools | Sample Analysis Summary.
Tools | Sample Analysis Summary.
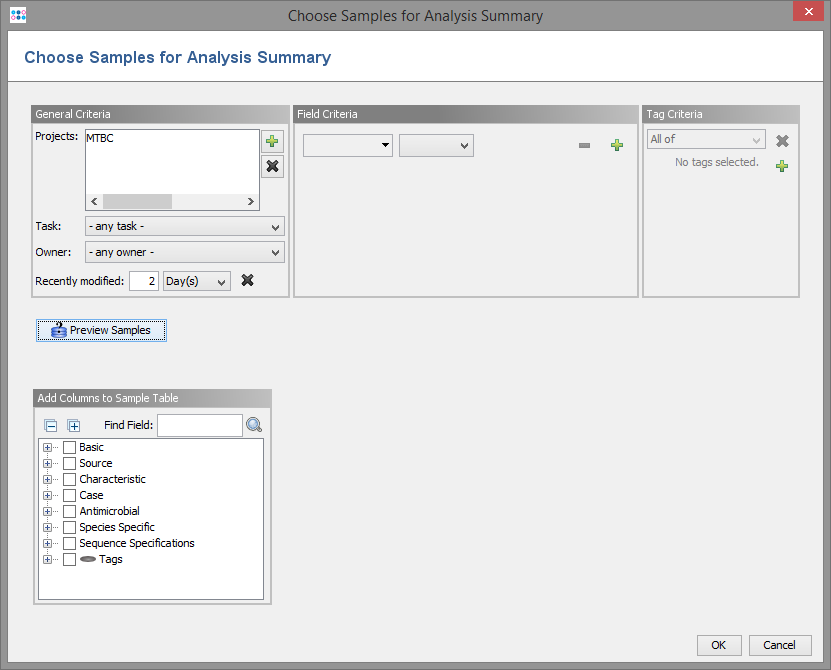
The summary will show the distribution of target analysis results (missing/failed/succeeded) for multiple Samples. The summary can be calculated for Samples that are currently opened in workspace or for Samples in the database:
- to create an analysis summary for Samples from the database a search criteria can be defined.
- to create an analysis summary for Samples from workspace the Samples can be selected. The selected Samples must share one or more Task Templates.
Additional Sample fields can be included into the summary tables.
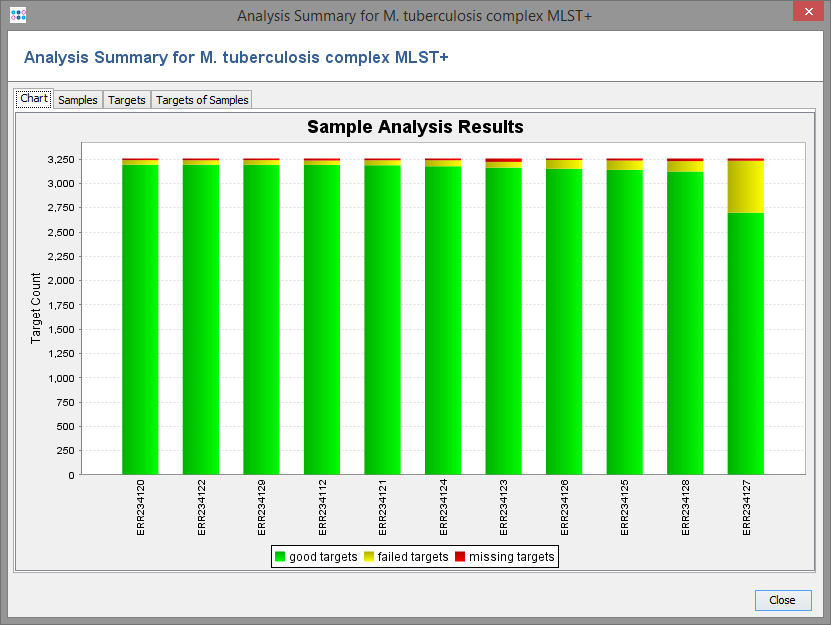
The Summary contains a chart that shows color coded the distribution of tasks that
- were not found (red)
- failed the analysis checks (yellow)
- succeeded (green)
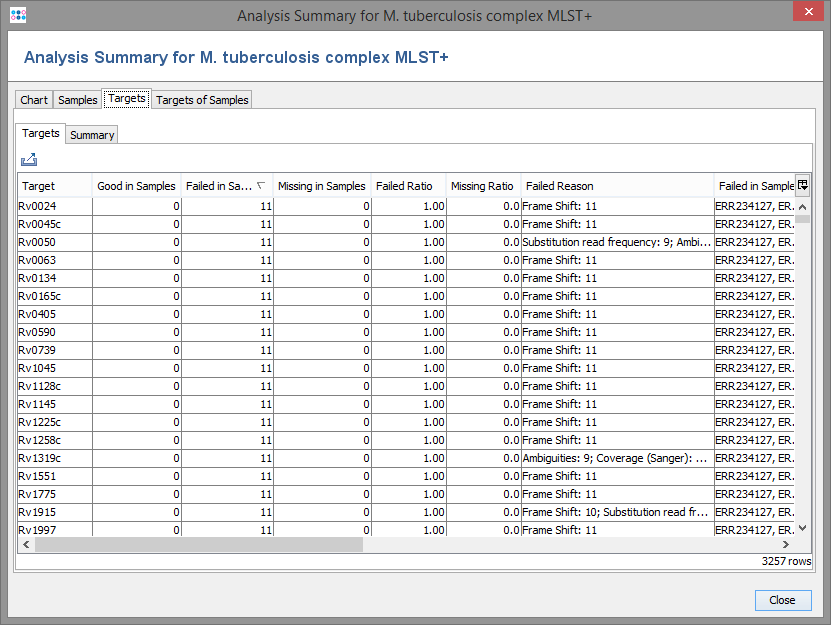
Tables that show the distribution of missing/failed/good targets per Sample and the results per target are also included. The column "Fail Reason" contains the distribution of the first analysis problems found.