| wiki | search |
Contents |
Overview
This tutorial describes how to use the Ridom SeqSphere+ software to analyze next-gen sequencing data with classic MLST and with an extended MLST (MLST+) with local allele types for more than 1000 targets.
Furthermore, it is explained how to use a predefined MLST/MLST+ schema for automated sequence analysis. Neisseria meningitidis is used exemplarily for this demonstration. However, by reading this tutorial you should be able to define your own projects for other species.
This tutorial requires Windows 7 64bit.
Preliminaries
- Step 1: This tutorial requires a running SeqSphere+ client and server. If not done yet:
- Download and install the SeqSphere+ 64bit client and server software on your computer.
- Start the SeqSphere+ server, then start the SeqSphere+ client and initialize the database.
- For evaluation purpose a free evaluation license can be requested.
- Step 2: Download the example data archive SeqSphere_Examples_PGM_N_meningitidis.zip for this tutorial, and extract the zip-file on your computer.
Defining Project and Task Templates
- Step 1: First launch the SeqSphere+ client and connect to your SeqSphere+ Server.
- Step 2: Then create a new Project for use with your Sample data with the menu: File | New | Project
- Step 3: Enter a name for your project (e.g., Neisseria)
- Step 4: Each Project within SeqSphere+ needs to have at least one Task Template associated. In this example we will add two different Task Templates to the Project: one for classic MLST and one for experimental MLST+. Press the button
 Add Manually to add the first Task Template.
- Step 5: Press
 Create New
- Step 6: Choose Create Task Template for Next-Gen Sequencing Data.
- Step 7: Now choose Create Task Template by Predefined MLST Schema.
- Step 8: Choose as organism Neisseria spp. and the data will be downloaded from the public MLST server. Then click Next.
- Step 9: This step shows the Target Parameters for the Task Template (e.g., the quality check parameters). They can be left unchanged. Click Next.
- Step 10: Check the name of your new Task Template, and confirm with Finish.
- Step 11: Press OK to save the new Task Template and add it to your Project.
- Step 12: Press the button Add Manually again to add a the second Task Template.
- Step 13: The Task Template managing dialog opens. Click on the
 Import from File button and browse to the tasktemplates directory in the downloaded tutorial data.
- Step 15: Choose the file N_meningitidis_FAM18_1070.tasktemplate for import. Click OK in the Import Task Template window.
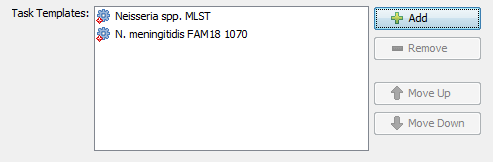
- Step 16: After the Task Template has been imported be sure to select it, and press the button OK to add it to your Project. The Task Template list should now look like this:
- Step 17: Finally press OK to save your Project.
Importing the Genome Sequencing Data
- Step 1: Choose from the menu File | Create Samples from Assembled Genomes
- Step 2: Choose the Project you just created.
- Step 3: If none or only one Task Templates is in the Tasks list, press the
 Add Task button to the right, and select both Task Templates of the Project.
- Step 4: Now use the button
 Add from File and choose the four .ace.gz-files from the tutorial data folder. Those files are de-novo assemblies (assembled with MIRA) of NGS data.
- Step 5: The upcoming window allows to specify sequencing information. Skip this step by clicking OK.
- Step 6: Click on the button Advanced Settings and make sure the checkboxes Perform auto-correction for homopolymer error and Automatically assign or submit new allele types are marked.
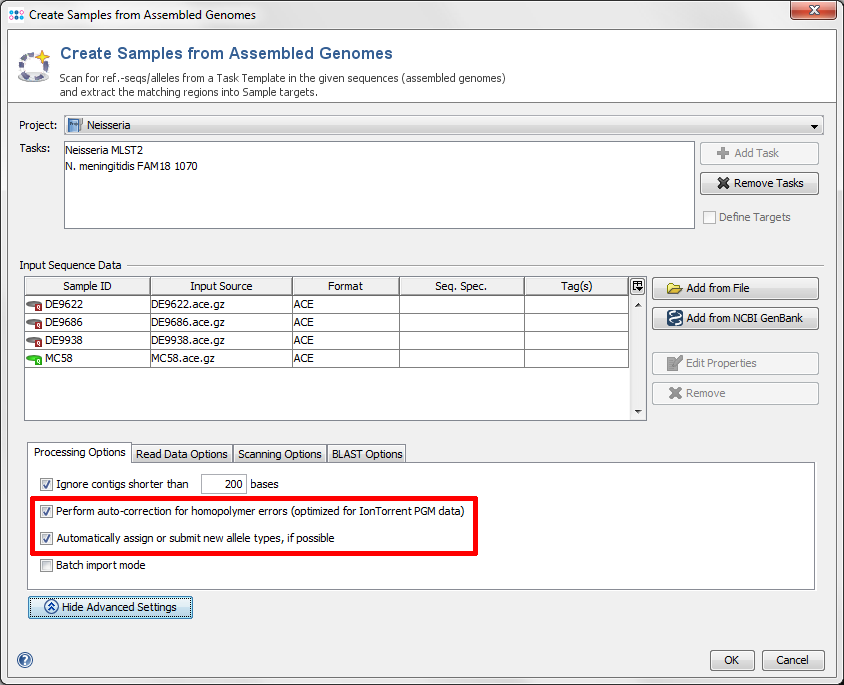
- Step 7: Confirm with OK to start Sample creation (this may take 5-10 minutes on a Intel Core i7 CPU). Progress is displayed in the status bar at the bottom of the SeqSphere+ window.
- Step 8: Ridom SeqSphere+ now loads all input sequences and finds (by using built-in BLAST) each of the target reference sequences that are defined in the Task Template.
- Step 9: The scanning result for each input sequence is shown in table format, listing all the targets with their percent identity, alignment, start and stop positions and other relevant data points. The first column of table marks the targets that should be imported into SeqSphere+. By default, only the targets that fulfill the specified identity and alignment thresholds (e.g., 90% identity to ref.-seq., and 99% aligned of ref.-seq.) will be added to the new Sample entry. The targets that don't have a unique match that fulfills the thresholds are colored red. The thresholds are normally taken from the Task Template, but they also can be changed in this step.
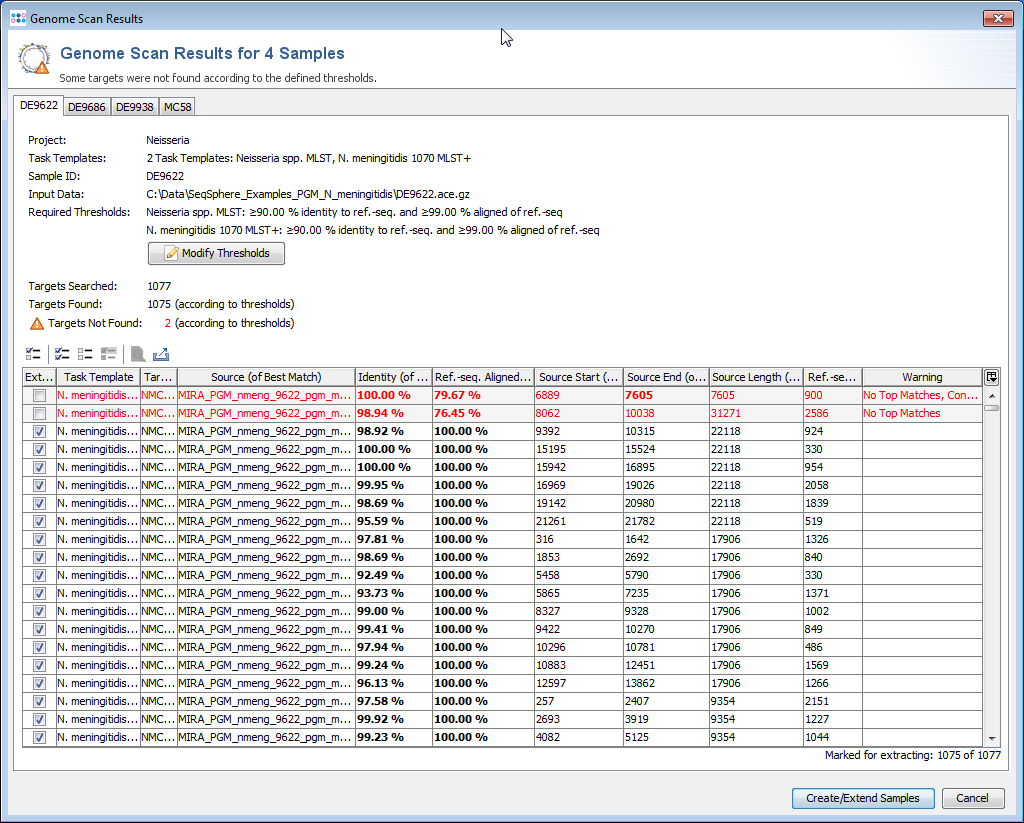
- Step 10: The
 Show details for target result button above the table can be used to show all BLAST hits for a target, and to show the alignment between the ref.-seq. and the assembled contig or genome region.
- Step 11: Press the button Create/Extend Samples to import the targets that are checked in the first column.
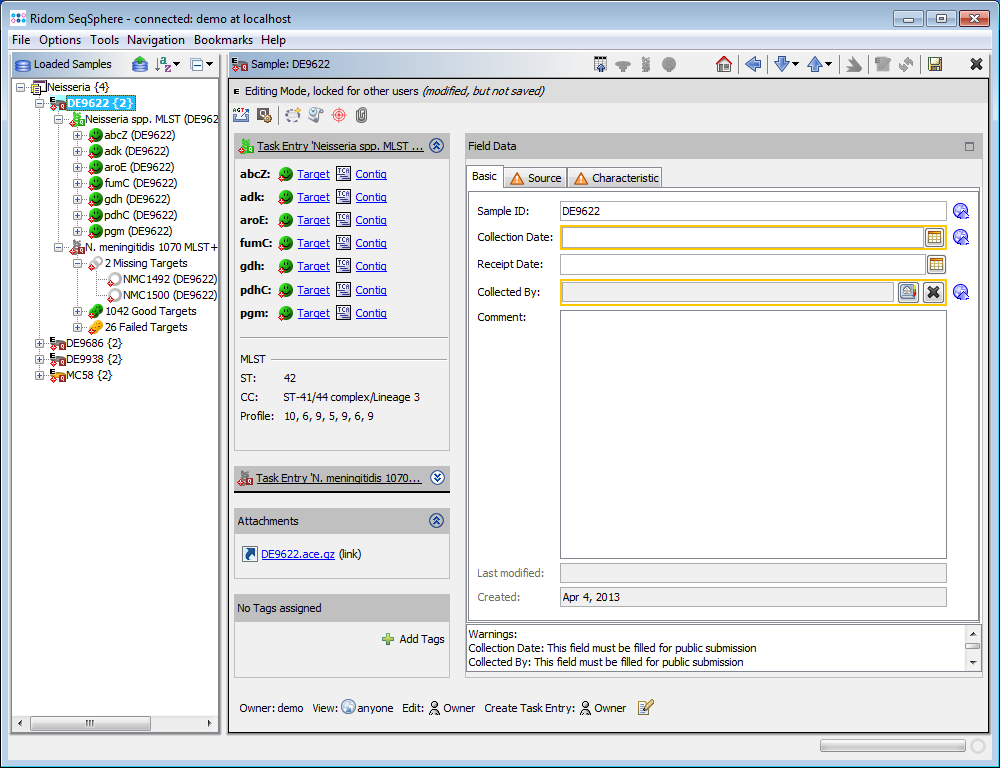
Editing Samples of Imported Genome Sequencing Data
- Step 1: After the import is completed, the navigation tree shows all new Samples. Each Sample node in the navigation has two sub nodes: The classic MLST task and the MLST+ task. Below the task nodes there are the target nodes. Each target node represents one sequence (often a gene) extracted from the input data (genomes or wgs contigs). The targets can have different states:
-
 Grey Targets were not extracted (because the match did not reached the thresholds in the previous step)
-
 Green Targets were extracted and fulfill all requirements that are defined in the Task Template Analysis Parameters.
-
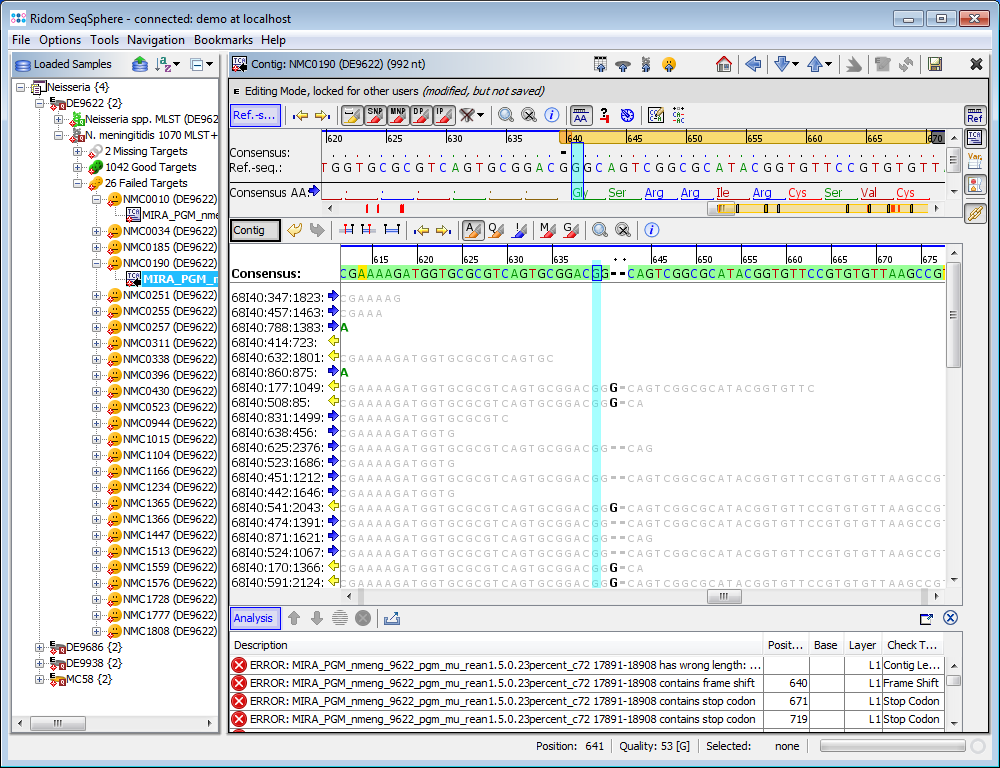
 Yellow Targets were extracted, but fail at least in one of the requirements that are defined in those parameters. For example, they may have frame shifts and incorrect lengths compared to the published FAM18 strain sequence. Those targets must be inspected further.
-
- Step 2: Select Tools | Position Navigator from the menu. Initially all yellow targets are selected, so just click OK. After a short while the Position Navigator is opened. This window shows the most interesting positions in the new sequences.
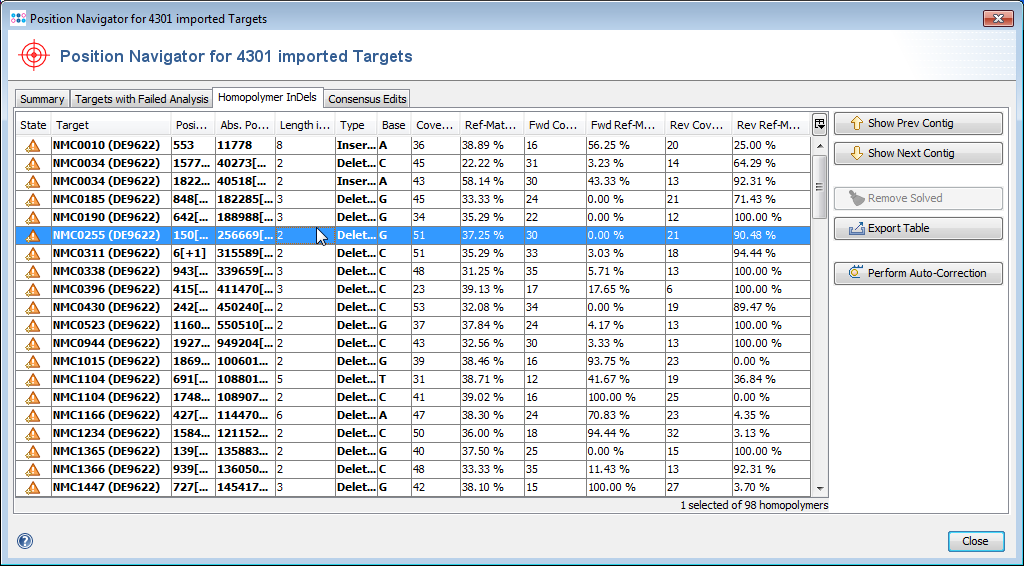
- Step 3: Double click on a row in the table to jump to the according position in the contig. Errors that cannot be corrected automatically must be manually edited in the contig. Changes can be made to the sequence itself here by right-clicking on the sequence and choosing form the options in the context menu, Add base, Delete base, etc. For example, if many stop codons exist in contig, most likely there is a frame shift. This can be found by scrolling through the list of analysis problem locations.
- Step 4: Finally click on File | Save All to store the new Samples in the database of the server.
Analyzing the MLST and MLST+ Results
- Step 1: For each imported Sample there is now on node in the navigation tree on the left.
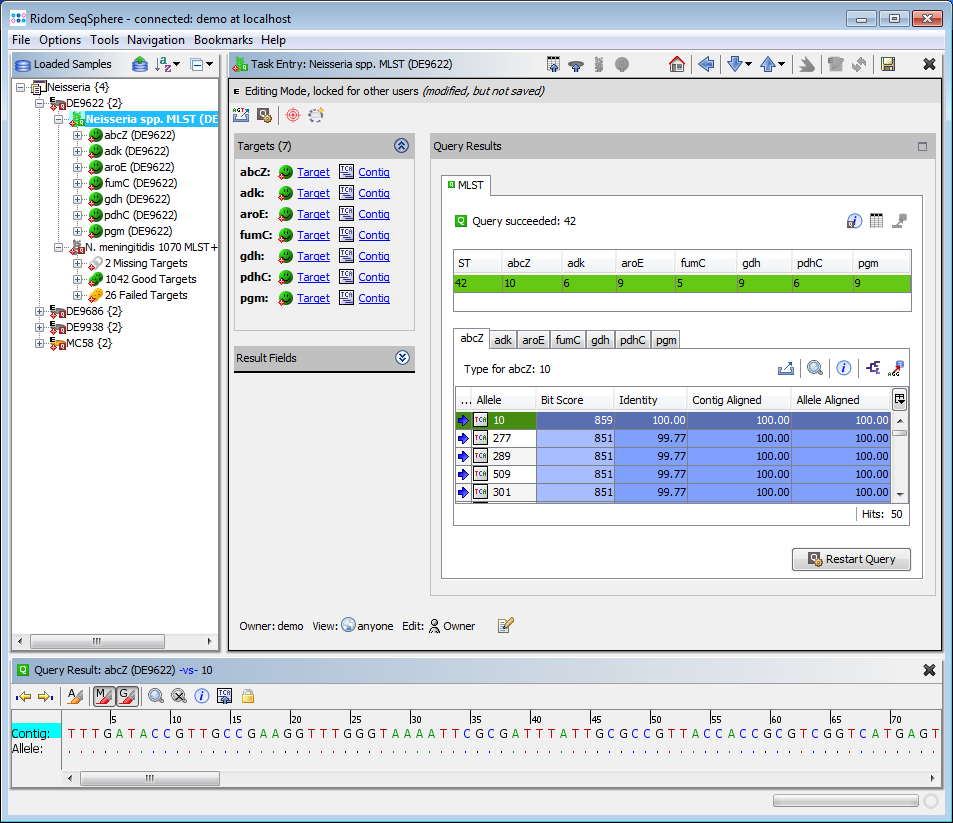
- Step 2: Double click on the sub-node Neisseria spp. MLST below such a Sample node to show the MLST results.
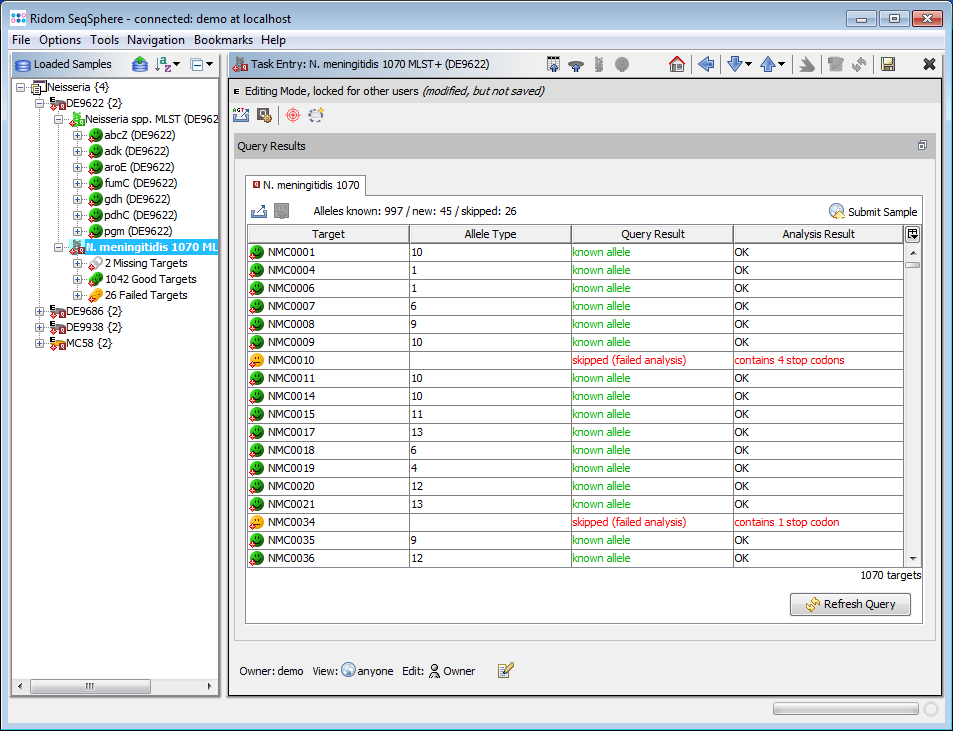
- Step 3: Double click on the sub-node N. meningitidis 1070 MLST+ to show the MLST+ results for the selected demonstration schema.
- Step 4: When multiple Samples were imported a Comparison Table can be created. This will show the allele types of the Samples in table format. Any differences between Samples can be determined. The Comparison Table offers tools for distance calculation and phylogenetic trees, and also can be exported into Excel spreadsheet format.
- Step 5: From the menu Tools | Comparison Table and press New Definition.
- Step 6: Enter a name for your Comparison Table definition.
- Step 7: Choose your new project.
- Step 8: In the box Typing Results select the checkboxes for N. meningitidis 1070.
- Step 9: Confirm with OK two times.
- Step 10: A table with all allele types of the four Samples is shown.
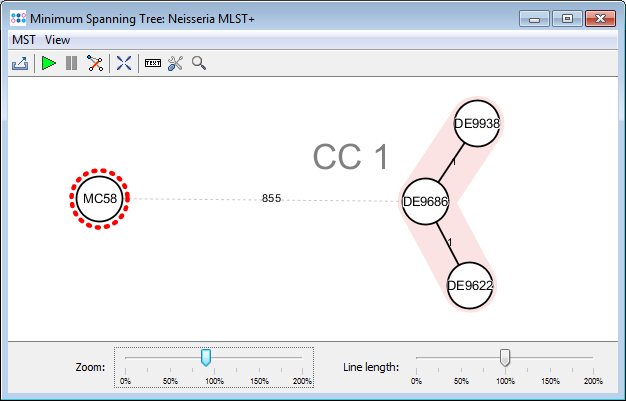
- Step 11: Press the
 Minimum Spanning Tree button in the toolbar to calculate the distances between the Samples and draw a minimum spanning tree for them. If the table contains missing data (targets that have no allele types assigned yet), the columns can be automatically removed from distance calculation by selecting Remove Columns from Distance Calculation.