
| wiki | search |
Contents |
1 Overview
- This tutorial describes how to use the Ridom SeqSphere+ software to analyze next-gen sequencing data with multiple layers of genotyping.
- PGM 200bp de novo assembled whole genome shotgun (WGS) data of 3 Neisseria meningitidis samples of a community outbreak is analyzed with:
- MLST
- extended MLST (eMLST)
- antigen sequence type (AST)
- vaccine antigen (4CMenB)
- antibiotic resistance gene (ARGene)
- The analysis of this sequence data with these multiple layers of genotyping was published by U. Vogel et al. (JCM 50: 1889, 2012).
- Furthermore this step by step tutorial describes how figures 1(A), 2 and 3 of the Life Technologies application note Bacterial Typing using the Ion PGM™ System and Ridom SeqSphere+ software is reproduced.
2 Preliminaries
- Installation: This tutorial requires a running SeqSphere+ client and server. If not done yet: Download and install the SeqSphere+ client and server software on your computer. Start the SeqSphere+ server, then start the SeqSphere+ client and initialize the database. For evaluation purpose a free evaluation license can be requested.
- Tutorial Data: Download the example data archive SeqSphere_Examples_PGM_200bp_N_meningitidis.zip for this tutorial, and extract the zip-file on your computer. The example data contains Neisseria meningitidis PGM 200bp WGS data (de novo assembled with MIRA) of 3 samples of a community outbreak that was published by U. Vogel et al. (JCM 50: 1889, 2012).
3 Creating the Project
- Step 1: Create a new Project with the menu: File | New | Project
- Step 2: Enter a name for your Project (e.g., Neisseria multiple typings)
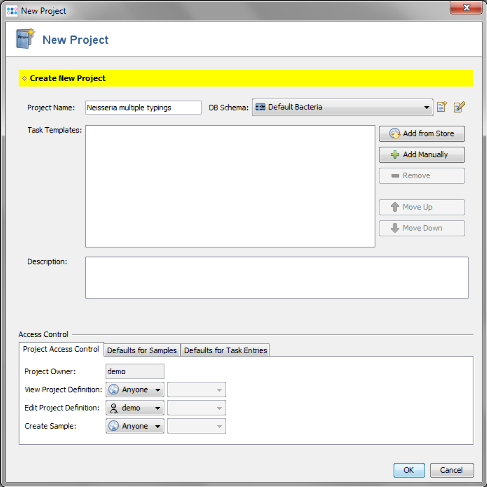
- Step 3: Press
 Add from Store in the Task Templates section.
- Step 4: Choose as organism Neisseria meningitidis.
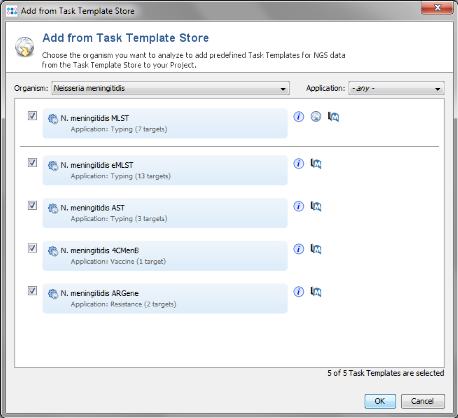
- Step 5: Select all 5 Task Templates that are listed for this organism by marking the checkboxes. Confirm with 'OK' to download the Task Templates.
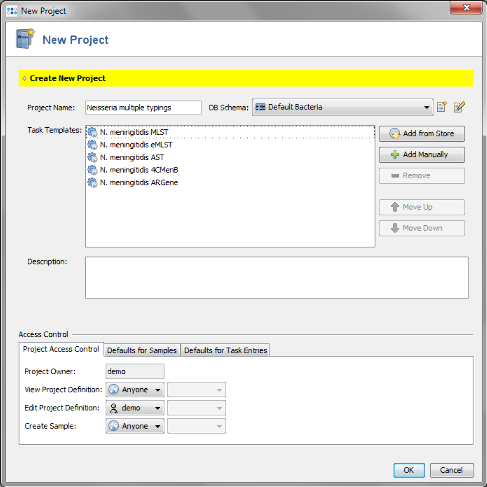
- Step 6: The Project now contains 5 Task Templates. Confirm with 'OK' to save the Project.
- Ridom SeqSphere+ is a resequencing software. Once you have setup your project you can literally analyze hundreds/thousands of sequence data automatically.
4 Import the Outbreak Strains
- Step 1: Choose from the menu File | Create Samples from Assembled Genomes.
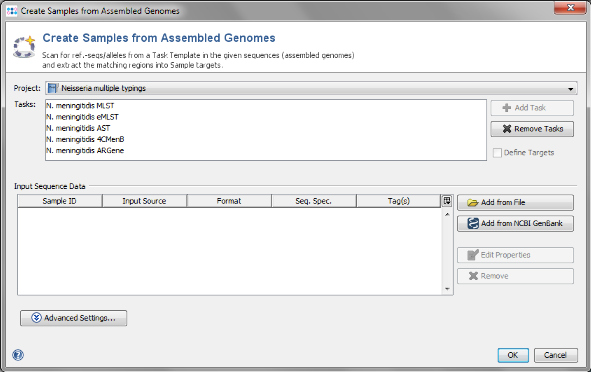
- Step 2: The new Project you just created and the 5 Task Templates should be preselected already. Now use the button
 Add from File and choose the 3 .ace.gz-files from the tutorial data folder. Those files are de novo assemblies (assembled with MIRA) of NGS data.
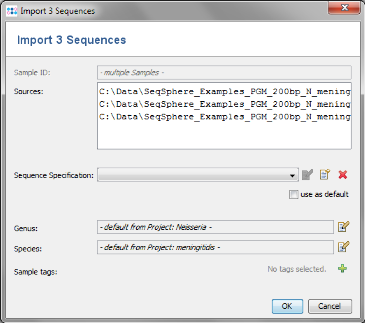
- Step 3: The upcoming window allows to define the sequence specification. The field for Sequence Specification is empty because no specifications are defined yet. Click on the
 button to create a new one.
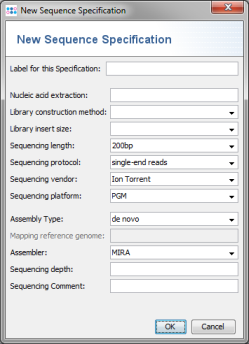
- Step 4: The Sequence Specification dialog windows shows all the fields that can be used. This is not needed for this tutorial. Press Cancel to close the dialog.
- Step 5: Click OK to confirm window and add the 3 sequence files to the import list.
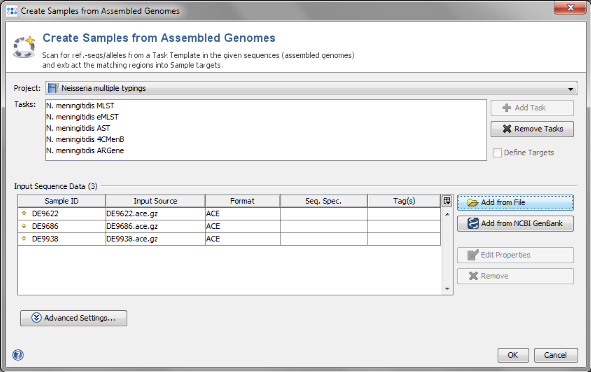
- Step 6: The sequences are now added to the import list. Confirm with OK to start the import process.
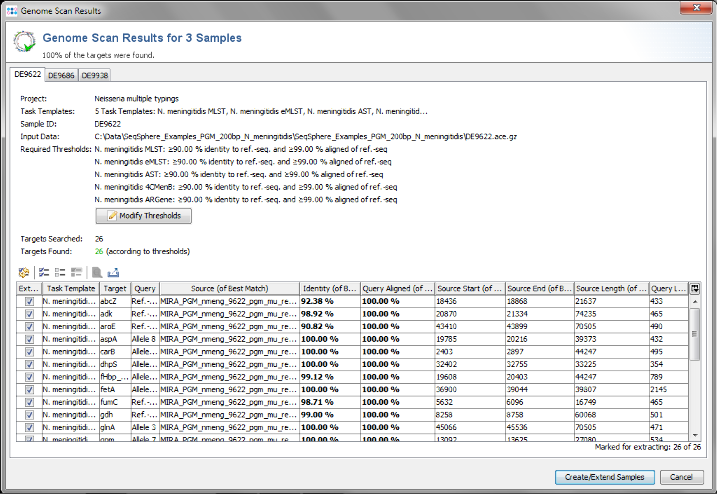
- Step 7: Ridom SeqSphere+ now loads all input data and searches for the target reference sequences or alleles that are defined in the Task Template (using a built-in BLAST) . After this step has been done, a preview window with scanning result for each input sequence file is shown. A table per Sample lists all the targets with the found matches. All targets that are checked in the first column of the table will be imported into SeqSphere+.
- The results for the targets are rated by specified thresholds for identity and aligned length of the best match (e.g., 90% identity to ref.-seq., and 99% aligned of ref.-seq.). The thresholds are defined in the Task Template, but they also can be changed in this preview step. Targets that do not have a match that reaches the thresholds, or targets that have multiple matches that reach the thresholds, will not be imported into SeqSphere+ by default. The rows of these targets are colored red. However, in this preview step these targets can still be selected manually by checking the box in the first column (e.g., if multiple matches should be ignored).
- This preview step is not shown when using the batch mode. For this tutorial all settings can be left to default, Confirm with the Create/Extend Samples button to continue.
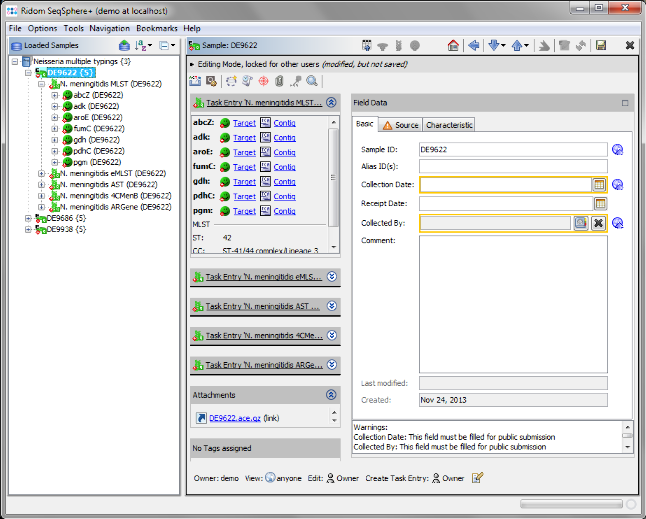
- Step 8: After the import is completed, the navigation tree shows the 3 new Samples. Each Sample node in the navigation has 5 sub nodes, one for each Task Template. Below the task nodes there are the target nodes. Each target node represents one sequence (often a gene) extracted from the input data (genomes or wgs contigs). All targets have passed the predefined checks and have therefore the green icon
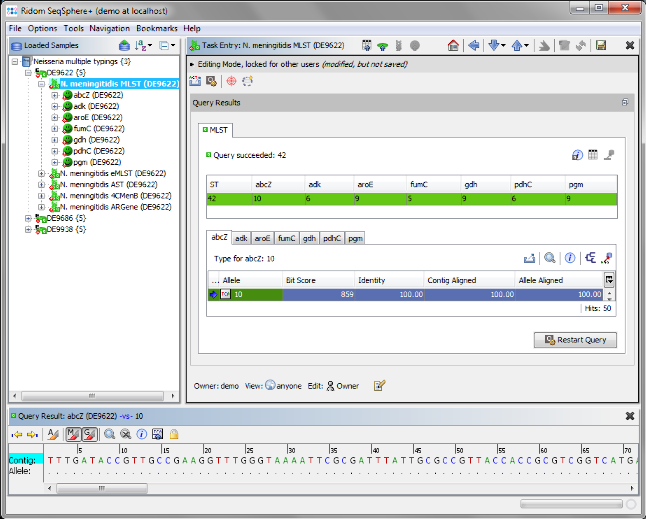
 . The typings were automatically performed. Double-click on a Task node below the Sample to see the allele types.
- Step 9: Choose from the menu
 File | Save All to store the 3 Samples to the database on your SeqSphere+ server.
5 Analyzing the Typing Results
- Step 1: Choose from the menu Tools | Comparison Table to perform phylogenetic analysis.
- Step 2: Press New Definition.
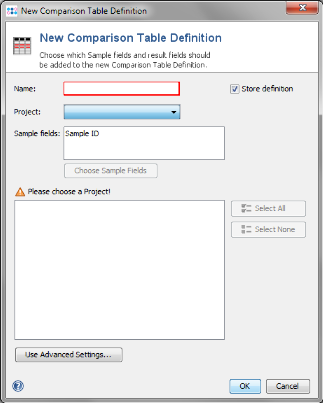
- Step 3: Choose the new project and press Select All in the query result section to include all imported targets of the 5 Task Templates. Enter an name for the comparison table definition and press OK to store the definition and to fetch the data from the Samples.
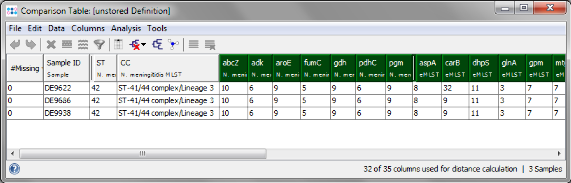
- Step 4: The comparison table is opened and shows the data for the three Samples. The columns with a green header are used for distance calculation. Press the
 Minimum Spanning Tree button in the toolbar to calculate the distances between the Samples and draw a minimum spanning tree for them. The minimum spanning tree shows that there is one allele difference in one of the strains
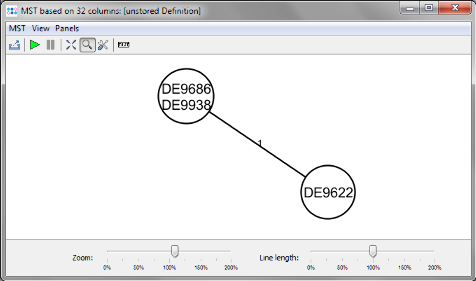
- Step 5: Go back to the comparison table window and click on the Sample DE9622 to select it. From the menu choose Analysis | Set as Comparison Sample and confirm the default settings (Difference Count, pairwise ignore unknown values).
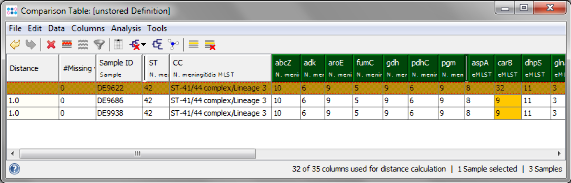
- Step 6: Column carB is now highlighted orange, because DE9622 has a different allele type than the two others. Mark all three rows (click and drag with mouse) and right-click in the first row of the carB column. Choose Compare Allele Sequences for carB from the popup menu.
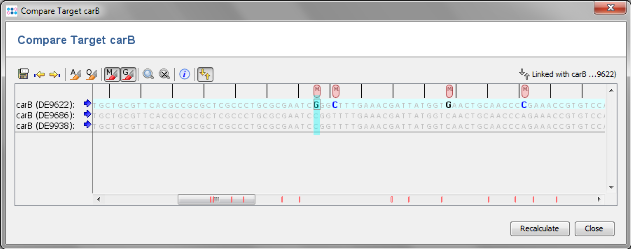
- Step 7: An alignment of the carB alleles of the 3 Samples is shown. The red marks in the scrollbar highlight the 14 differences between DE9622 and the two other strains. This recombination event was independently confirmed in the publication by Sanger sequencing on both strands. So one recombination results in 14 SNPS, but only in one allele difference.
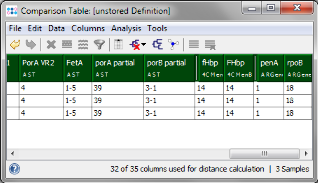
- Step 8: The last two columns of the comparison table belong to the Task Template for antibiotic resistance (ARGene). The extracted allele types for penA and rpoB can be used to predict susceptibility. Cited from the publication: "In the penA database at www.Neisseria.org, penA allele 1 is associated with a susceptible phenotype, because it lacks the typical mutations associated with reduced susceptibility. The same held true for rifampin, where allele 18 is in line with a susceptible phenotype."
.