

Contents
Overview
The Comparison Table of SeqSphere+ is used to compare and visualize Sample data. Each row of the table represents one Sample and each column represents a metadata field. Color groups can be used to group and highlight Samples according to values of a column (default is field 'Epi Info').
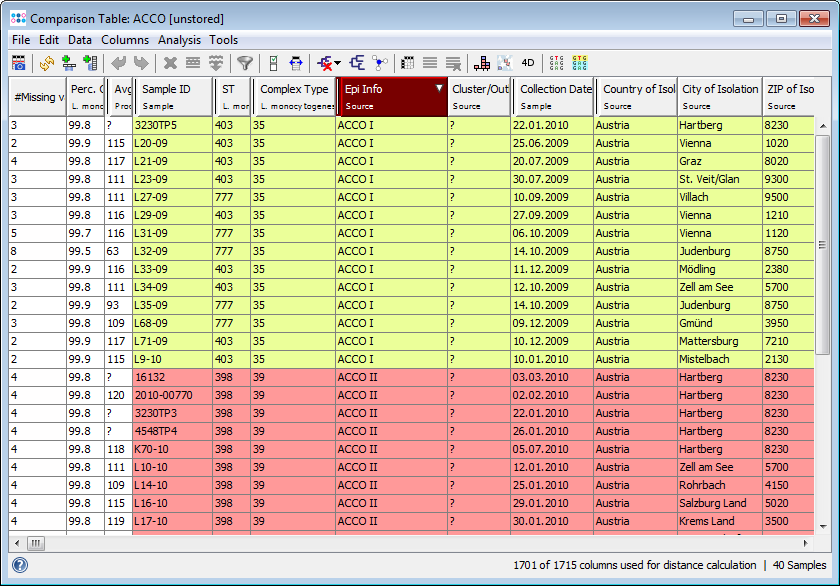
A selection of multiple columns can be used for distance calculation (e.g., allele type columns). The calculated distances can be used for various analysis functions (via Analysis menu or toolbar button):
- a
 minimum spanning tree (MST) can be calculated and opened in a new window
- a
 neighbor-joining or UPGMA tree can be calculated and opened in a new window
- a
 distance matrix can calculated and opened
- a neighbor-joining or UPGMA can be calculated and included as first column in the table. Thereby the table can be ordered by position of Samples in the phylogenetic tree
- a
 comparison Sample can be set. Distances to this comparison Sample are then calculated for all other Samples, and the differing values are highlighted in orange
The functions ![]() Find SNVs and
Find SNVs and ![]() Find Group Specific SNVs in Distance Columns can be used to find SNVs in Samples or group of Samples.
Find Group Specific SNVs in Distance Columns can be used to find SNVs in Samples or group of Samples.
The place and time information of Samples can be visualized with a ![]() geographical map and an
geographical map and an ![]() epi curve.
epi curve.
Comparison table and minimum spanning tree content and layout (including coloring) can be stored in snapshots for later reuse. The Sample search criteria, epi and procedure metadata column layout, and used genotyping schemes can be stored in retrievals for later reuse.
Opening Comparison Tables
Select ![]() Tools | Comparison Table from the menu to open the Comparison Table dialog with three different tabs, that allow to open comparison tables using three different ways:
Tools | Comparison Table from the menu to open the Comparison Table dialog with three different tabs, that allow to open comparison tables using three different ways:
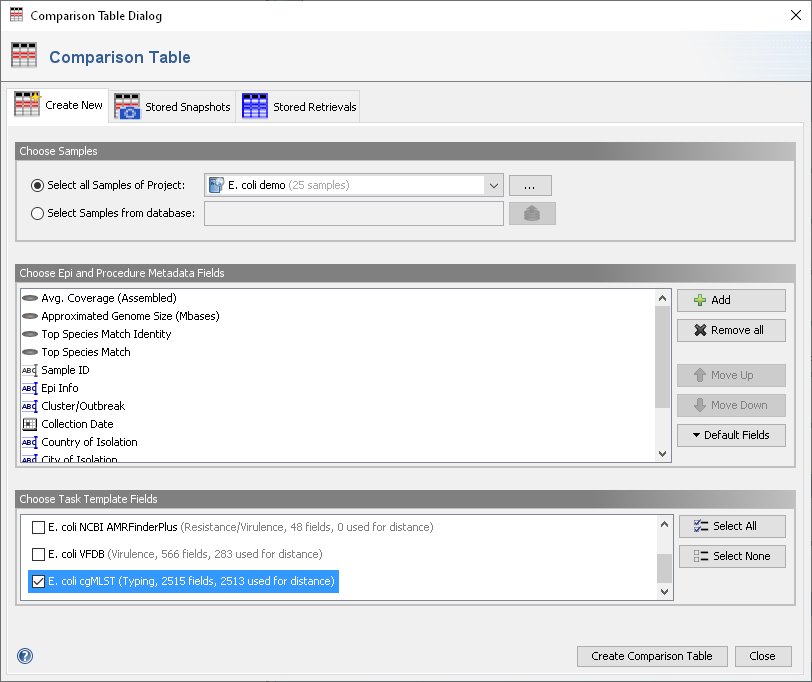
- Create New
- This tab panel can be used to create and open a new comparison table with Samples from a whole Project, a selection of Samples from database (e.g., from multiple Projects or by using other advanced search criteria), or from Samples that are currently loaded. In addition Epi and Procedure Metadata Fields and Task Template Fields that should be included in a Comparison Table can be chosen here. When the newly created comparison table is opened, it retrieves the Sample data from the database. If not stored as a snapshot the comparison table is not permanently preserved.
- Stored Snapshots
- This tab panel shows all stored Comparison Table Snapshots that are visible for a specific user (by default stored snapshots are only visible for the user storing the snapshot) and allows to open a comparison table from a stored snapshot. A comparison table that is opened from a snapshot contains not necessarily the current data of the database but shows instead the data as they existed when the snapshot was stored. Therefore, a snapshot may even contain Samples that were in the meantime deleted from the database. The panel can also be used to export, edit properties, or delete snapshots. Furthermore, snapshot favorites that should be shown permanently on the SeqSphere+ home screen can be defined here.
- Stored Retrievals
- This tab panel shows a drop-down list with all stored Comparison Table Retrievals that are visible for a specific user (by default stored retrievals are only visible for the primary group of the user storing the retrieval) and allows to open a comparison table from the stored Sample search criteria, epi and procedure metadata column layout, and used genotyping schemes of a retrieval. A comparison table that is opened from a retrieval contains the current data from the database. Therefore, no Sample data are stored in a retrieval but only the search criteria for Samples and the selection of metadata fields. The panel can also be be used to create new retrievals or to manage (edit, delete, access control, etc.) retrievals.
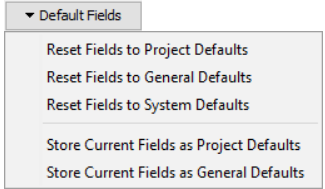
When creating a new comparison table or using a stored retrieval, the list of Epi and Procedure Metadata Fields starts with the general default fields, or with the specific project default fields if defined in the project definition for the selected project. The drop down button ![]() Default Fields can be used to change the current list of selected fields to the project defaults, the general defaults, or the unchangeable system defaults. It can also be used to overwrite the project defaults or the general defaults with the current selection of fields.
Default Fields can be used to change the current list of selected fields to the project defaults, the general defaults, or the unchangeable system defaults. It can also be used to overwrite the project defaults or the general defaults with the current selection of fields.
![]() Hint: A Comparison Table can also be opened from the Search Samples dialog for the found samples in the search result table.
Hint: A Comparison Table can also be opened from the Search Samples dialog for the found samples in the search result table.
QC Field Highlighting
The following QC fields are by default added to a comparison table, and are highlighted in case of warning (yellow) or error (red) according to field specific rules:
- Per. Good Targets1)
- Average Coverage (Assembled)2)
- Approximated Genome Size (Mbases)
- Top Species Match3)
- 1) Only available if a cgMLST task template is used in the Project
- 2) Only available if assembled with a SeqSphere+ pipeline or imported from ACE/BAM/GenBank
- 3) Only available if processed in a SeqSphere+ pipeline with enabled Contamination Check (Mash Screen).
Color Groups
Color Groups are used to highlight Samples in different colors. The menu command ![]() Set Color Groups by Column Values can be used to create and assign color groups based on the values of a specific column.
By default, the Samples are colored according to the values in the 'Epi Info' column. If this columns is not present, Samples are colored by the MLST 'ST' column if it exists.
Set Color Groups by Column Values can be used to create and assign color groups based on the values of a specific column.
By default, the Samples are colored according to the values in the 'Epi Info' column. If this columns is not present, Samples are colored by the MLST 'ST' column if it exists.
The column that is currently used for coloring is highlighted with a red column header in the table.
To edit, export, and import color groups select the command Manage Color Groups from the Data menu. A new dialog will open that contains an editable list of all existing groups. Each color group is defined by a name and a color.
A color group can also be manually assigned to Samples, by selecting Samples in the Comparison Table, and choosing the menu command Data | Set Color Group for Selected Samples (or via the comparison table entry context menu).
Distance Calculation
Some functions (e.g., trees) require that one or more columns are selected for distance calculation. The columns that are currently selected for distance calculation are highlighted with a green column header.
By default, all target columns (i.e., allele types) of the chosen genotyping schemes are used for distance calculation.
The selection of columns for distance calculation can be modified in three ways:
- by using
 Select Genotyping Schemes for Distance Calcuation (via Column menu or toolbar button) to select or unselect genotyping schemes,
- by clicking the right mouse button on the column header and selecting or unselecting the chekbox Use in Distance Calculation,
- or by using
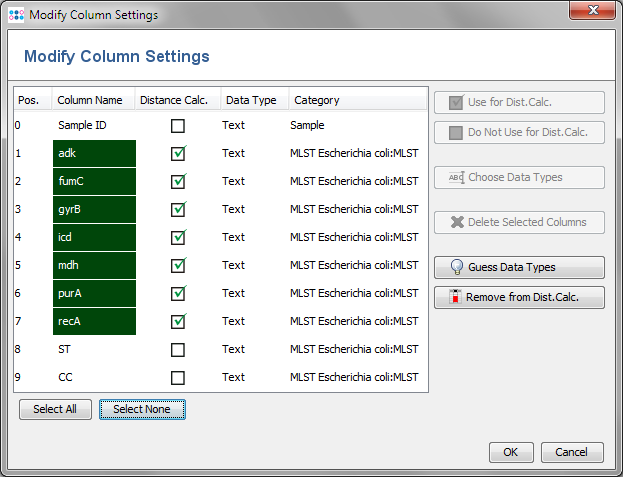
 Modify Column Settings (via Column menu) to open a dialog for managing the columns.
The selection of columns for distance calculation may also be modified by the missing values dialog. This dialog appears if missing values were found during distance calculation. If the option to exclude columns is selected in this dialog, then the columns are removed from distance calculation, until they are manually selected again.
Data Types
Each column has a data type. Usually, the predefined data types are adequate. The data types can be changed in two ways:
- by using the Modify Column Settings (via Column menu) or
- by clicking the right mouse button on the column header. This opens a context menu, that allows choosing the data type for a column.
Menu
File
-
 Save Comparison Table Snapshot (including open MST)
- Export Comparison Table Snapshot to File
-
 Export Table Data (csv/xlsx): Exports the table in various formats
- MS Excel (.xlsx): exports the table data including the table cell colors
- MS Excel 97-2003 (.xls): exports the table data only
- CSV-file: exports the table data as comma separated values file
- HTML-file: exports the table data including the table cell colors as HTML table that can be viewed in a web browser
- PNG-file: exports the complete table including if used a tree in the table as image
-
 Add Table Rows from File: Adds data to the current table from a MS Excel files (.xlsx, .xls) or CSV file
- Close: Close the Comparison Table window and all dependent windows (e.g., MST)
Edit
- Select All: Selects all displayed Samples
- Select None: De-selects all displayed Samples
- Invert Selection: Inverts the current selection. All unselected Samples are selected, and all selected Samples are unselected
- Select Samples with Missing Values: Allows to select Samples that contain missing values in more than a specified percentage of columns for distance calculation
- Select Samples By Color Group: Allows to select Samples that belong to a specific color group
-
 Find: Searches for values in the complete table or in specific columns. The search ignores upper/lower-case
-
 Undo: Undoes the last command (only available for some commands like remove)
-
 Redo: Does the last undone command again (only available for some commands like remove)
Data
-
 Refresh Samples in Table with Current Data from Database: Retrieves the current data for the columns and sample in the table, and updates the table. This can be used to update a snapshot after changes were made in the database
-
 Add Additional Samples to Table: Chooses additional Samples from the database and add them to the table
-
 Remove Selected Rows from Table: Removes selected Samples from the table
-
 Remove All Unselected Rows from Table: Removes all but the selected Samples from the table
-
 Moves Selected Rows to Exclude List: Moves selected Samples to the exclude list. The Samples on this list are not used in calculation anymore, but can be restored easily using the command Restore from Exclude List
-
 Move All Unselected Rows to Exclude List: Moves all but the selected Samples to the exclude list. The Samples on this list are not used in calculation anymore, but can be restored easily using the command Restore from Exclude List
-
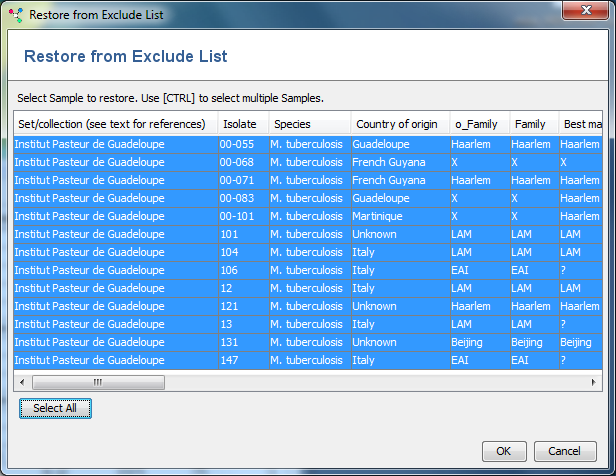
 Restore from Exclude List: Opens a window with all Samples in the exclude list and the option to remove Sample(s) from this. Those Sample(s) are re-added to the comparison table. Hint: Use CTRL to select multiple Samples.
-
 Clear Exclude List: Removes all Samples from the exclude list (without adding them to the table).
- Hide in Geo Map and Epi Curve: Hides selected Samples from geographical map and epi curve
-
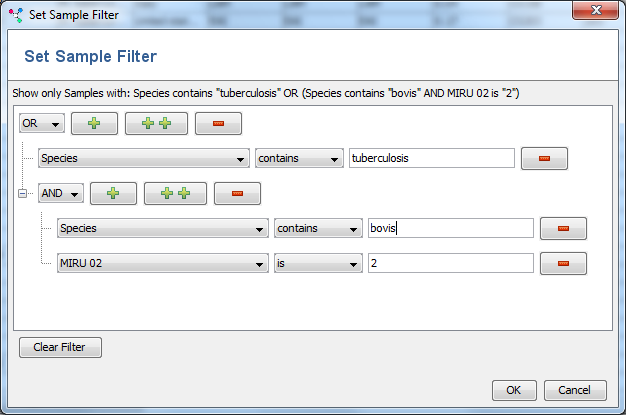
 Set Sample Filter: Opens a window to select a filter. Only Samples that match the filter criteria (e.g., coverage, etc.) are displayed in the table and used in distance calculations. Clear filter to reconstitute all Samples again
- Manage Color Groups: Opens a window for managing all existing color groups. Color groups can be added or removed, and the names and colors of existing groups can be modified
- Set Color Groups for Selected Samples: If one or more Samples are selected, this sub-menu can be used to assign groups to the Samples. Select No Group to remove the Samples from a color group. Create New Group creates a new color group
-
 Set Color Groups by Column Values: Automatically creates groups based on the values that are present in a column and assigns Samples to these groups according to these values
Columns
-
 Add Additional Database Fields as Columns: Allows to add additional fields from the database to the comparison table
- Modify Column Settings: Opens a window to select the Data Types for each column and to choose which columns should be used for distance calculation
-
 Select Genotyping Schemes for Distance Calculation: Allows to select one or multiple genotyping schemes for distance calculation
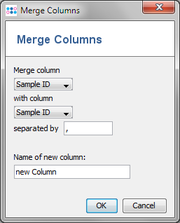
- Merge Columns: Creates a new column from two given columns. A separator can be specified that is used to separate the content of the two columns
-
 Remove Resistance/Virulence Genotyping Columns Where All Values Are Missing: If resistance or virulence task template were used in the comparison table, this function can be used to removes all columns of those task templates, that contain missing values in all cells
- Transform Resistance/Virulence Genotyping Columns to Absence/Presence (+/-): If resistance or virulence task template were used in the comparison table, this function can be used to removes all values of those task templates, into '+' if they are not empty or unknwon, else into '-'.
- Remove Dist. Columns Where All Values Are Missing: Removes all distance columns that contain missing values in all cells
- Remove Dist. Columns where Any Value Is Missing: Removes all distance columns that contain at least one missing value in a cell
- Remove Dist. Columns Where No Values Are Missing: Removes all distance columns that contain no missing values in any cell
- Remove Dist. Columns with Identical Values (missing as identical): Removes all distance columns that contain the same value in all cells, handling missing values as identical, i.e. always equal to other values.
- Remove Dist. Columns with Identical Values (missing as own category): Removes all distance columns that contain the same value in all cells, handling missing values as an own category which is only equal to other missing values.
- Remove All Columns Where All Values Are Missing: Removes all columns that contain missing values in all cells
- Show Column with Count of Missing Values: When selected, the number of missing values in distance columns is the first column for each Sample
- Highlight Missing Values in Distance Columns: Highlights all missing values in distance column cells
Analysis
- Set as Comparison Sample: Only available if exactly one Sample is selected. The selected Sample is used as Comparison Sample, and distances to all other Samples are calculated. Note that at least one column must be selected for distance calculation.
-
 Remove Comparison Sample: Only available if a Sample was selected as Comparison Sample. Removes the Comparison Sample and the distance column.
- Distance Matrix: Shows a distance matrix based on the columns that are currently selected for distance calculation.
- Tree in Table: Select either
 UPGMA Tree in Table or
  NJ-Tree in Table to draw such a tree in the table. The tree is based on the columns that are selected for distance calculation. The Samples in the table are ordered according to their position in the tree. Choose
  No Tree in Table to remove the tree from the table
- Neighbor Joining Tree: Opens a Neighbor Joining Tree to display either a NJ- or UPGMA-tree
- Minimum Spanning Tree: Opens a Minimum Spanning Tree to display a MST-tree
Tools
- Copy Distance Column Names to Clipboard: Copies the names of the distance columns to the clipboard for further usage (e.g., only not identical targets, etc.)
- Show Target Information for Distance Columns: Opens a window with all available target information of the distance columns (e.g., gene names)
-
 Find SNVs in Distance Columns: Opens the Find SNVs dialog
-
 Find Group Specific SNVs in Distance Columns: Opens the Find Group Specific SNVs dialog
- Calculate Discriminatory Index
- Calculate Typing System Concordance
- Calculate Color Groups Statistic
-
 Show Epi Curve: Opens a window with an Epi Curve
-
 Do Geocoding: Opens a Geocoding window that allows to assign Latitude and longitude coordinates to zip codes, city-, state- and/or country-names
-
 Show Geographical Map: Opens the Map window that displays the Samples on a map
-
 Show Four Dimensions: Opens all 'four dimensions' at once: place (geo map), time (epi curve), 'person' (comparison table), and type (minimum spanning tree)
Clicking in a row of the comparison table with the right mouse button opens a context menu which contains a subset of the commands described above.
Toolbar
The comparison table toolbar contains a subset of the menu commands described above.