

Please Note: Working with Plasmid Tables requires the Long Read Data Analysis Module
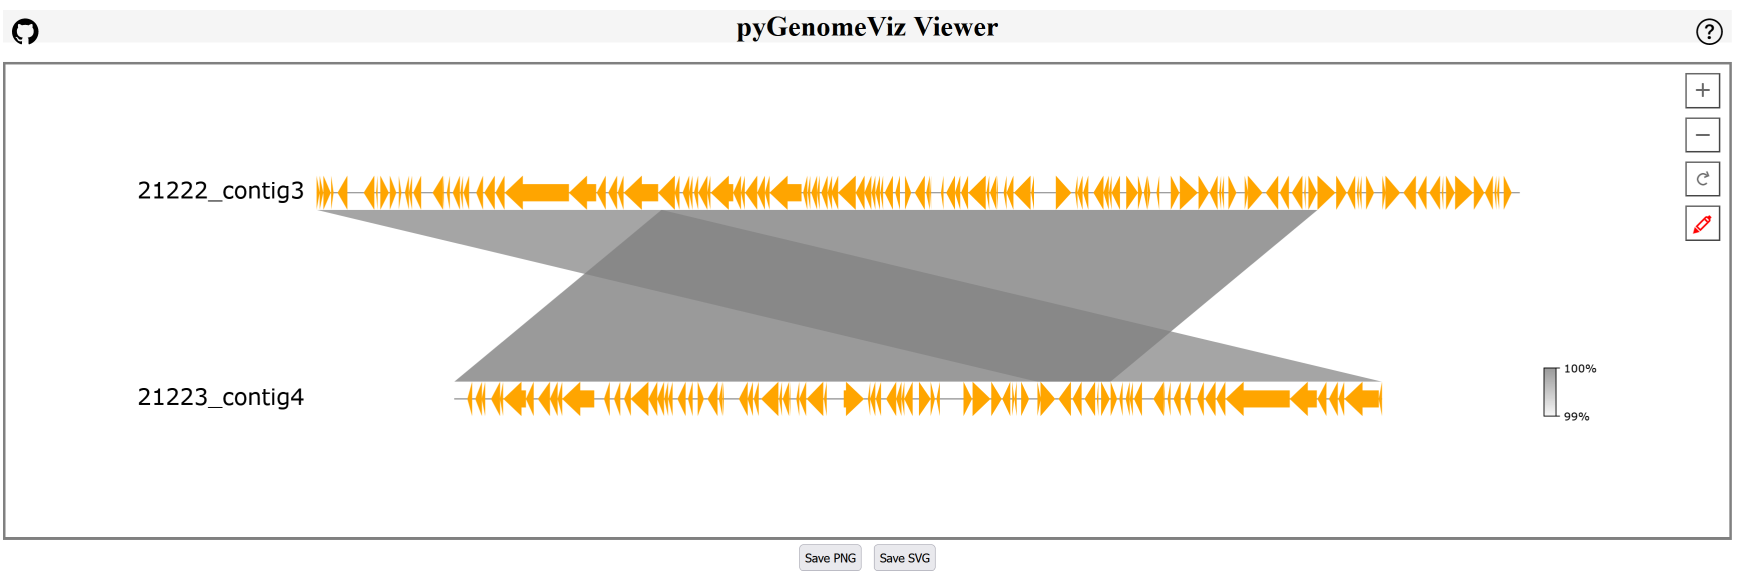
The Visualization with PyGenomeViz uses the program pyGenomeViz to display sequence comparison. It uses pyGenomeViz' command-line tool pgv-mummer together with MUMmer to align the given GenBank-files and shows aligned regions and genes.
The function is avaible as Tools > Vizualize GenBank Files with pyGenomeViz that allows to choose up to 10 GenBank files for visualization. The visualization can also be started from a Plasmid Table where it allows to compare selected plasmids.
 Important:
- If SeqSphere+ is installed on Windows, pyGenomeViz requires the Windows Subsystem for Linux (WSL).
- If SeqSphere+ is installed on Linux, pyGenomeViz must once be installed by calling the installation of Bioinformatic Tools on Linux.