

Contents
Overview
This tutorial describes how to use the Ridom Typer software to assemble and analyze Oxford Nanopore Technologies (ONT) long-read sequencing data from MinKNOW using the Ridom Typer Pipeline Mode.
For this demonstration, we use two vancomycin-resistant Enterococcus faecium (VRE) isolates with highly similar plasmids from the University Hospital Münster. You will learn how to assemble ONT reads and generate an Early Warning Alert (EWA) indicating a potential plasmid transmission. The tutorial is focused on the necessary steps to assemble ONT data specifically. If you are a new user of the software, we highly recommend to get familar with the pipeline mode and cgMLST approach first by following the tutorials Tutorial for Ridom Typer Assembly and cgMLST Analysis Pipeline and Tutorial for M. tuberculosis cgMLST Typing with Illumina Data. Plasmid reconstruction and plasmid transmission detection based on long-read data are introduced in the Tutorial for Plasmid Reconstruction and Characterization with Short- and Long-Read Data and Tutorial for Real-time Plasmid Transmission Detection and Alert from Long-read Sequencing Data.
Preliminaries
- Installation of Ridom Typer: If Ridom Typer is not available yet, a one-month trial version can be requested. The Ridom Typer Client and Server software can be installed on the same computer for this tutorial.
- Long Read functionality must be included in the Ridom Typer license (every trial license, every regular license since April 1, 2026, or older licenses with LRM).
- System Requirements: This tutorial requires at least 32 GB RAM and Windows with an installed Windows Subsystem for Linux (WSL) or a Linux system.
- Tutorial Data: Download the example data archive Ridom_Typer_Examples_ONT_run_VRE.zip (~400 MB) for this tutorial and extract the zip-file on your computer. This example data folder contains the MinKNOW output of two VRE isolates. The isolates were sequenced on an ONT MinION. Library preparation was conducted with the Rapid Barcoding Kit v14 (RBK) and basecalling was performed using Dorado v0.7.1 with super-accurate mode (SUP) model v4.3.
Create Enterococcus faecium Project with Mash Plasmid Typing
First, you need to define a project, where the assembled samples should be stored. If you have never created a project before, we suggest to do the Tutorial for M. tuberculosis cgMLST Typing with Illumina Data first for detailed step-by-step instructions. To analyze the plasmids in the ONT assemblies, a Mash plasmid typing needs to be defined and added to the project. Detailed instructions for this can be found in the Tutorial for Real-time Plasmid Transmission Detection and Alert from Long-read Sequencing Data.
- Step 1: Go to File | New | Create Project. Enter a Project Name, e.g. "VRE ONT Tutorial".
- Step 2: Press Download & Add to add Task Templates. Choose Enterococcus faecium from the Organism dropdown and select (at least) the following Task Templates: E. faecium cgMLST #1, NCBI AMRFinderPlus, Chromosome & Plasmid Overview, and CGE MobileElementFinder. Press OK to save your newly created project.
- Step 3: Go to File | New | Create Task Template. Select Create Task Template for Whole Genome Sequencing Data. Then select Create Task Template for Plasmid Mash Database. Leave all settings at the defaults and press Next.
- Step 4: Enter a Task Template Name, e.g. "VRE ONT Tutorial Mash AMR-prio plasmid typing". In the Use in Project dropdown, select the project you just created. Press Finish to add the typing to your project.
Set up Plasmid Early Warning Alert (EWA)
By default, plasmid EWAs are only triggered if the two source samples are not clonally related (i.e. have a cgMLST distance below a species-specific threshold). This threshold is defined by the cluster threshold in the cgMLST task template that is used in the project(s) of the respective samples. If multiple cgMLST schemes exist, the lowest cluster threshold is taken. In addition, clonal EWAs can be defined per project. If such a definition exists, the respective threshold will be used to exclude likely clonal transmissions from the plasmid EWAs.
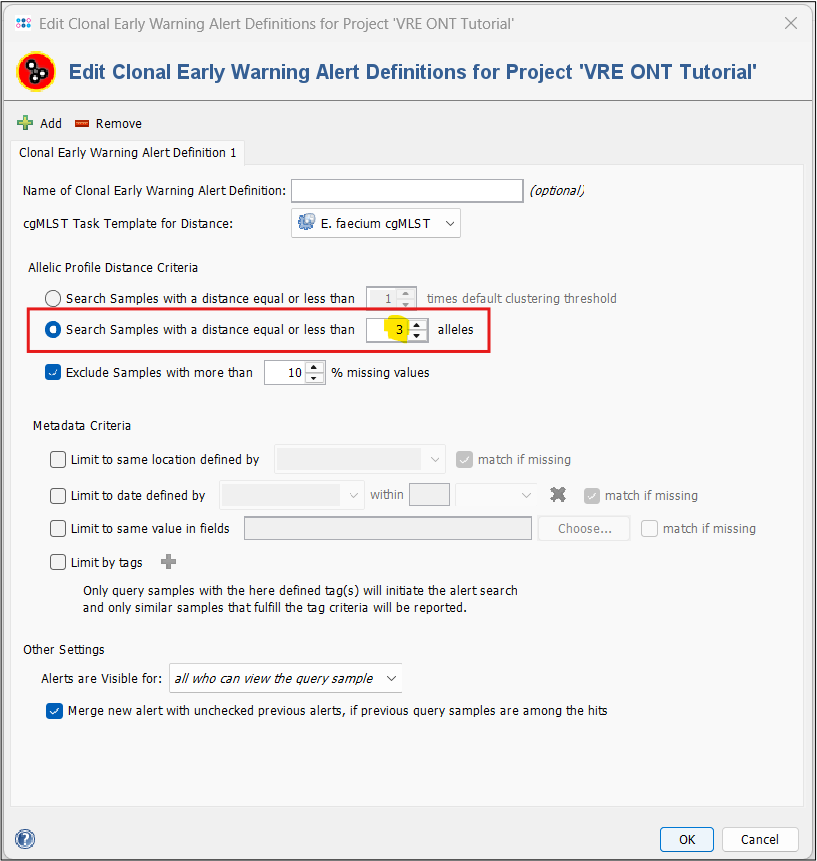
In the tutorial data, the two VRE samples have a cgMLST distance of 17 alleles. This is below the default threshold of the public E. faecium cgMLST scheme (20 alleles) and thus would not trigger a EWA by default. However, nowadays 3 is a more common threshold to define VRE clonal relations (see e.g. Kampmeier et al. (PMID: 30155243)). Therefore, we define a clonal EWA with a threshold of 3 in our tutorial project.
- Step 1: To activate plasmid EWAs for the Mash typing, go to Options | Mash Plasmid Databases. In the upcoming window, select the Task Template you just created and press
 Edit Early Warning Alert.
- Step 2: Select the checkbox Activate Early Warning Alert. Leave the settings at their defaults. Press OK and Save. Plasmid EWAs are now activated.

- Step 3: Now we define the clonal EWA in the project. Go to Options | Projects. In the left panel, select the tutorial project you just created. Press
 Add cgMLST Clonal Early Warning Alert Definition.

- Step 4: Under Allelic Profile Distance Criteria, select Search Samples with a distance equal to or less than 3 alleles. Leave the rest at the default settings. Press OK and then Save & Close.
Our project, task templates and EWA settings are now finished and we can continue with the assembly of the tutorial data using the Pipeline Mode.
Define Pipeline Script
- Step 1: Start the Ridom Typer Client without logging in and press the button
 Start Pipeline Mode on the bottom of the login panel or use the identical menu function in the File menu.
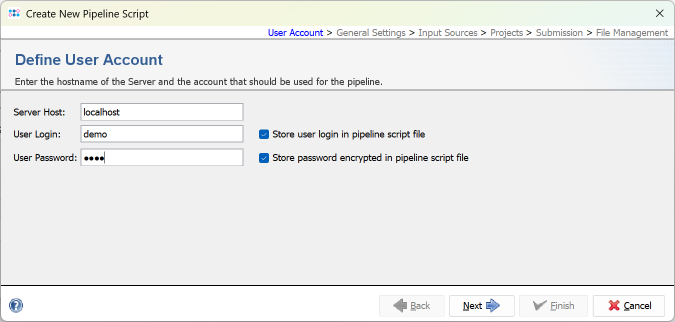
- Step 2: The pipeline mode window starts up. The pipeline mode is designed to run Ridom Typer in a non-interactive way to assemble, process, and analyze WGS data automatically defined by a pipeline script. Press Create New Script to open a dialog for creating a pipeline script. In the first step the Server Host and the User Login must be defined. Just use localhost for your local computer and the same Ridom Typer user account that you are normally using for the Ridom Typer login. The option to store user login in the pipeline script is enabled by default. Below enter the User Password of this user account. If wanted, the password can also be stored (encrypted) in the pipeline script. However, it should be taken into account that if the password is stored in the pipeline script, anyone with access to the computer can run the pipeline. For this tutorial check the Store password encrypted in pipeline script file checkbox.
- Press Next to move on.
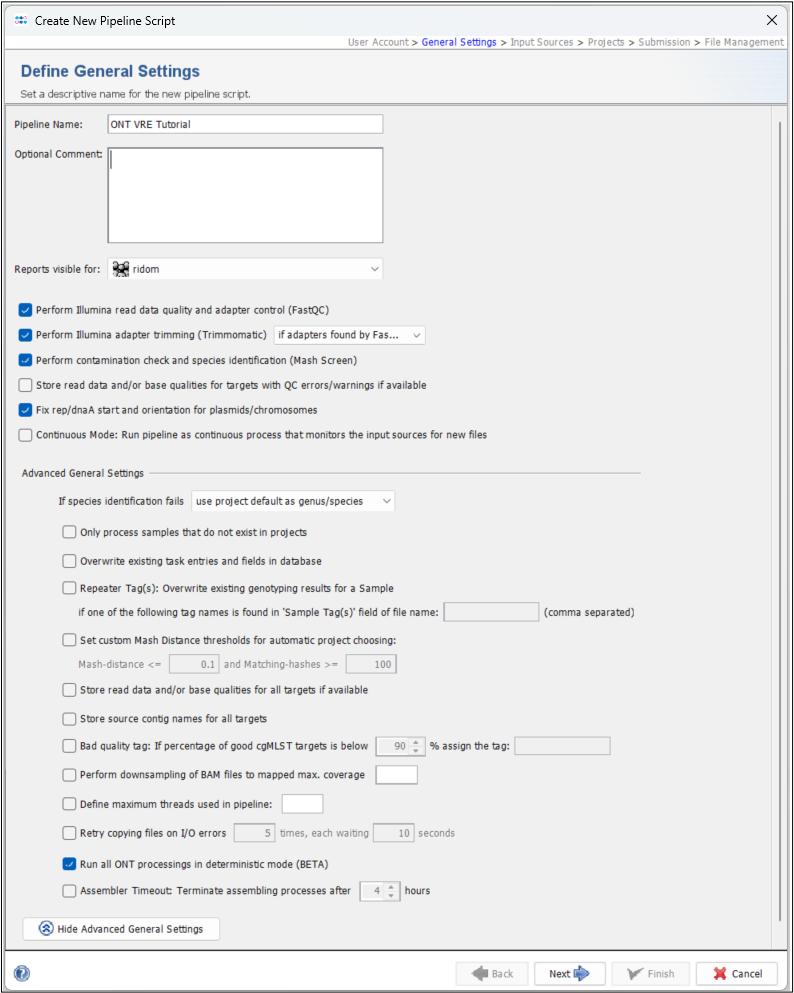
- Step 3: In the Define General Settings panel enter a Pipeline Name (e.g., "ONT VRE Tutorial"). The comment can be left empty and the access control for viewing the reports generated by this pipeline can be left to the user's group as default. Of the six checkboxes, the first three and fifth checkboxes are preselected by default. You can leave this pre-selection as is, although the first two options will be ignored with ONT data. Press the Advanced General Settings... button to show further settings. For this tutorial, select the second option from the bottom, Run all ONT processings in deterministic mode (BETA).
- Press Next to move on.
 Important: We do not recommend the deterministic setting for your routine pipelines. This will run Flye in deterministic mode, which is not the default because it is much slower. However, for the purposes of this tutorial, we want to make sure that you get the exact same final results, which requires a deterministic mode as Flye can introduce small variances, especially in plasmid assemblies.
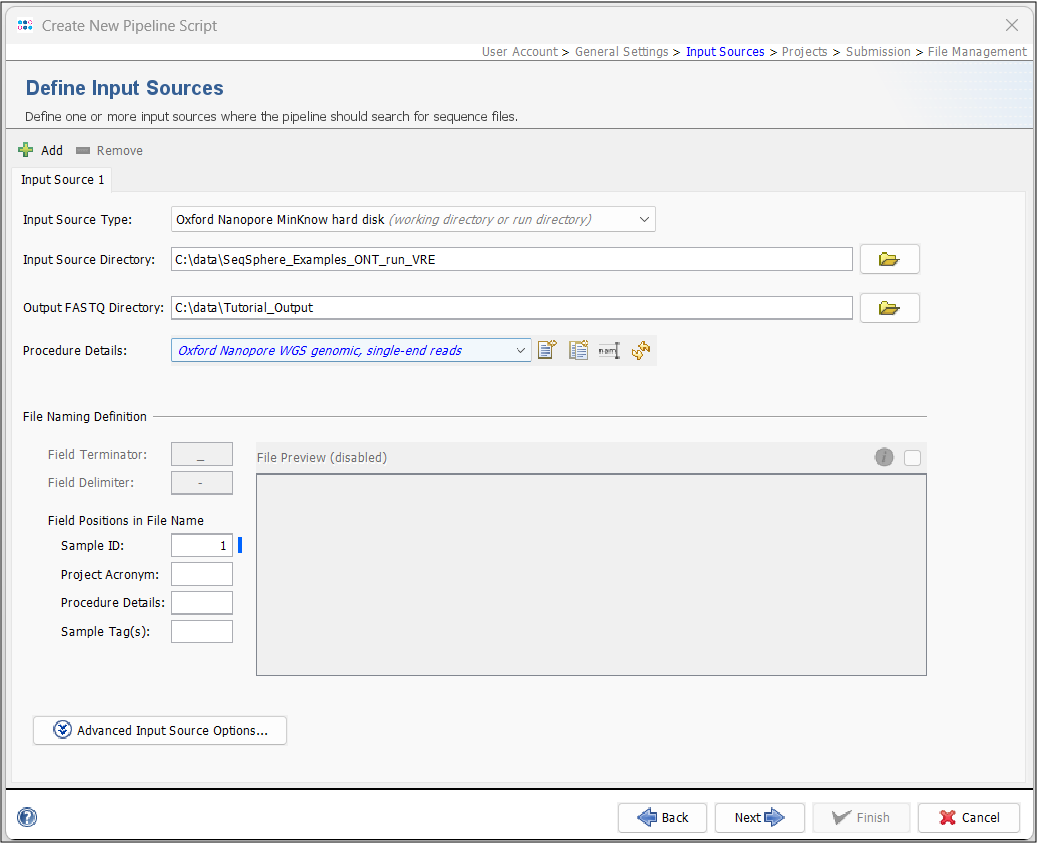
- Step 4: In the next panel, the Input Sources for the WGS sequence data are selected. In the Input Source Type dropdown, select Oxford Nanopore MinKNOW hard disk. To define the Input Source Directory, press the
 button and select the directory Ridom_Typer_Examples_ONT_run_VRE that was unpacked from the downloaded tutorial data file (see Preliminaries). Next, select a directory where the merged FASTQs should be stored. In the Procedure Details dropdown, select Oxford Nanopore WGS genomic, single-end reads.
- The File Preview is disabled. When you start the pipeline, a barcode definer will open where you match the Sample IDs with their respective barcodes (see Start Pipeline). The Field Terminator and Delimiter settings are also disabled as these are automatically set to match the merged FASTQs. However, Project Acronyms, Procedure Details or Sample Tag(s) could be set if they are delimited with a "-". For this tutorial, leave the Sample ID at position 1.
- Press Next to move on.
 Hint: If you use your own data and already have merged Fastq files, you can select Directory as Input Source Type and navigate to the folder containing the respective files. In this case, the File Preview and File Naming Definition will not be disabled.
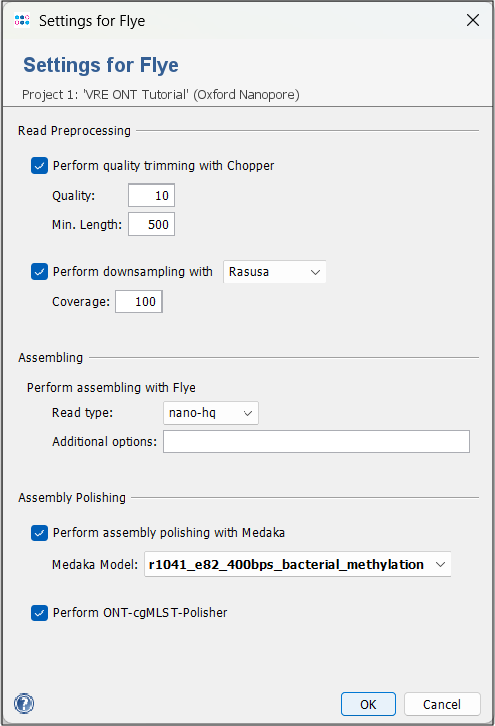
- Step 5: Next, in the Define Projects panel, select the project you created above in the Project Name dropdown. Leave all other settings at the defaults. Flye should by default be the selected assembler.
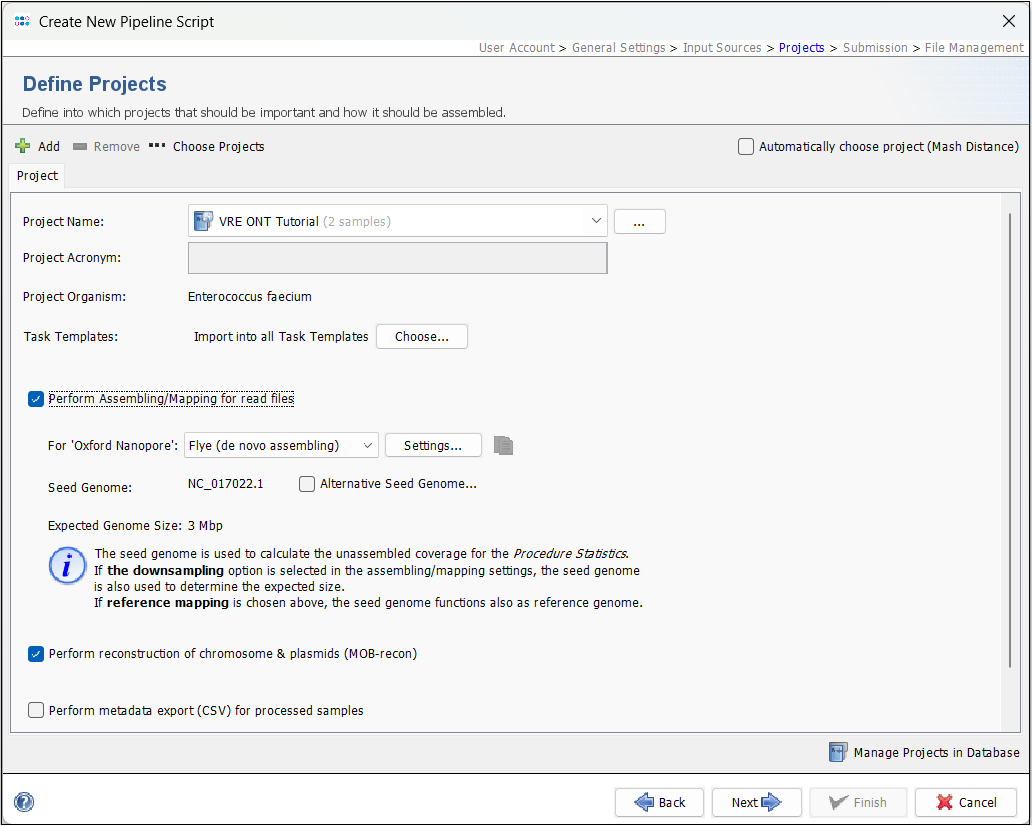
Press the settings button and make sure that Perform ONT-cgMLST-Polisher is enabled (default).
Press Next to move on.
- Step 6: You can leave the next panel, Define Submission at the default. If you are working with you own data and do not want to submit new CTs to the cgMLST.org Nomenclature Server, you need to deselect the checkbox.
- Press Next to move on.
- Step 7: You can leave the Define File Managment settings at the defaults as well.
- Press Finish to finish and save the pipeline definition.
Start Pipeline
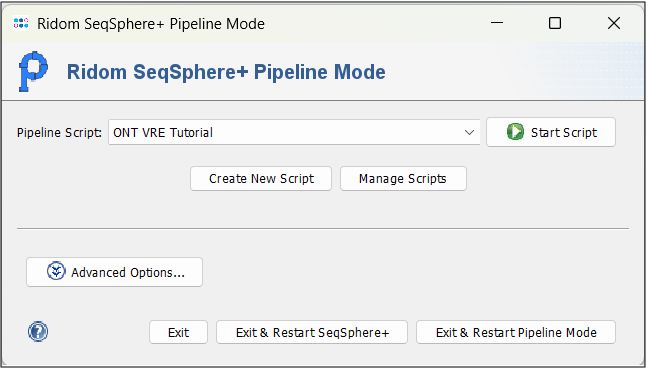
- Step 1: Start the Ridom Typer Client without logging in and press the button Start Pipeline Mode on the bottom of the login panel or use the identical menu function in the File menu.
- Step 2: From the Pipeline Script dropdown, select the pipeline script you just created and press
 Start Script to run the pipeline.
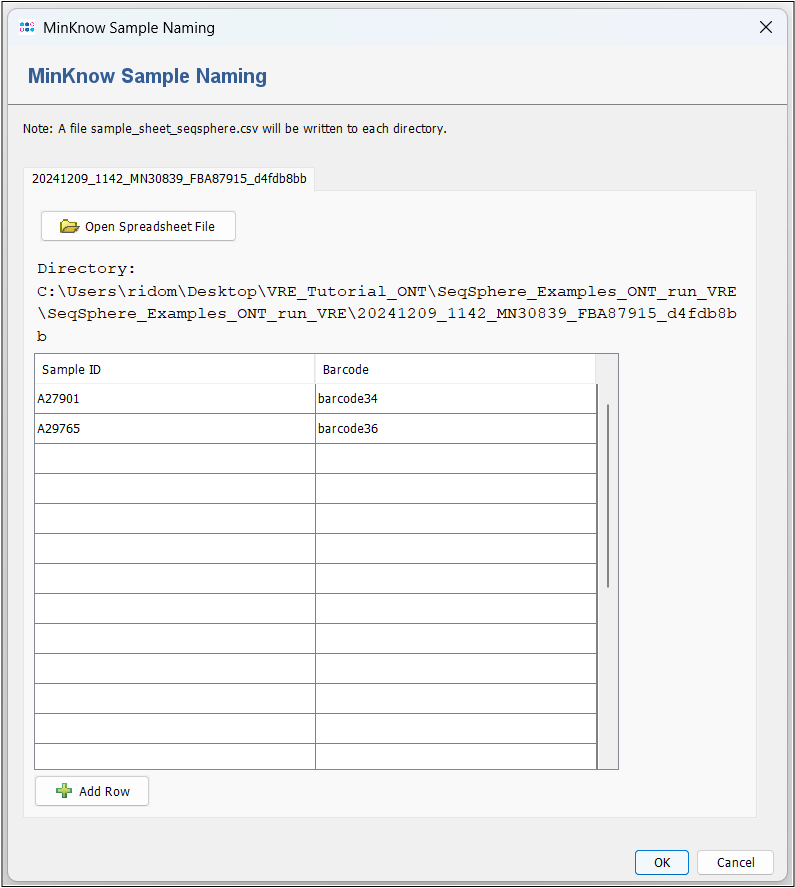
- Step 2: At first, the input folder is checked for a sample sheet, which contains the Sample IDs and matching barcodes. If such a file is not found (default), a MinKnow Sample Naming window will open. In the first row, enter A27901 in the Sample ID column and select barcode34 from the dropdown in the Barcode column. In the second row, do the same with A29765 and barcode36. Press OK. This will write a sample_sheet_seqsphere.csv file into the input folder. Please note that you need writing permission for the respective directory. Alternatively, you could use the Open Spreadsheet File button to point towards a file that contains the same information.
- Step 3: A blue colored progress window shows the current progress and messages of the pipeline. When the pipeline has finished, the background color turns to white.
- The runtime depends on the available resources. With 32 GB RAM (i9 CPU) it runs about 21 minutes.
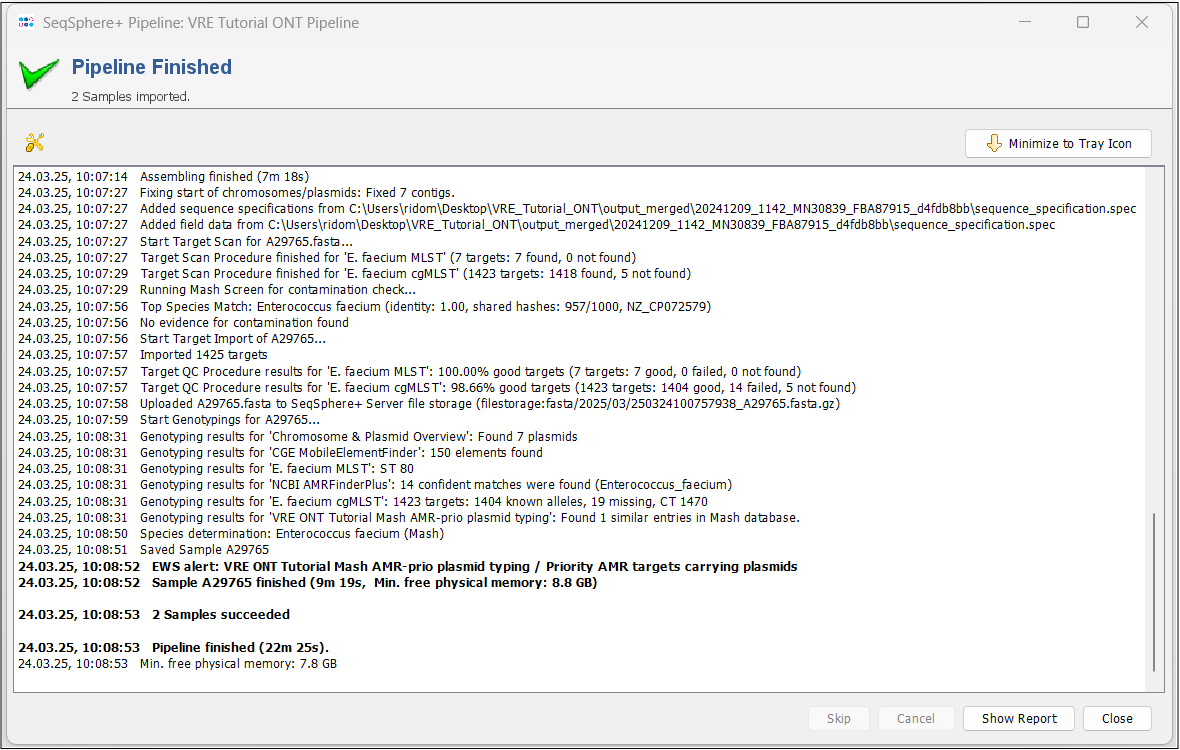
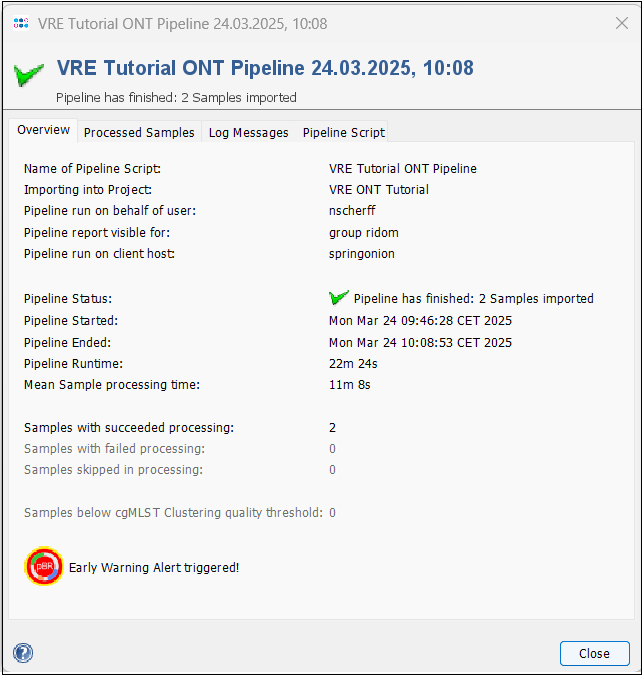
- Step 4: Press the Show Report button to see a quick overview for the statistics of the processed Samples. As you can see, an Early Warning Alert was triggered.
- Step 5: Close the report window, press Close in the pipeline progress window, and exit the pipeline mode with the button Exit and Restart Ridom Typer. The client is switched back to the normal interactive session mode that allows for viewing the results of the samples just processed.
Compare vanA plasmids
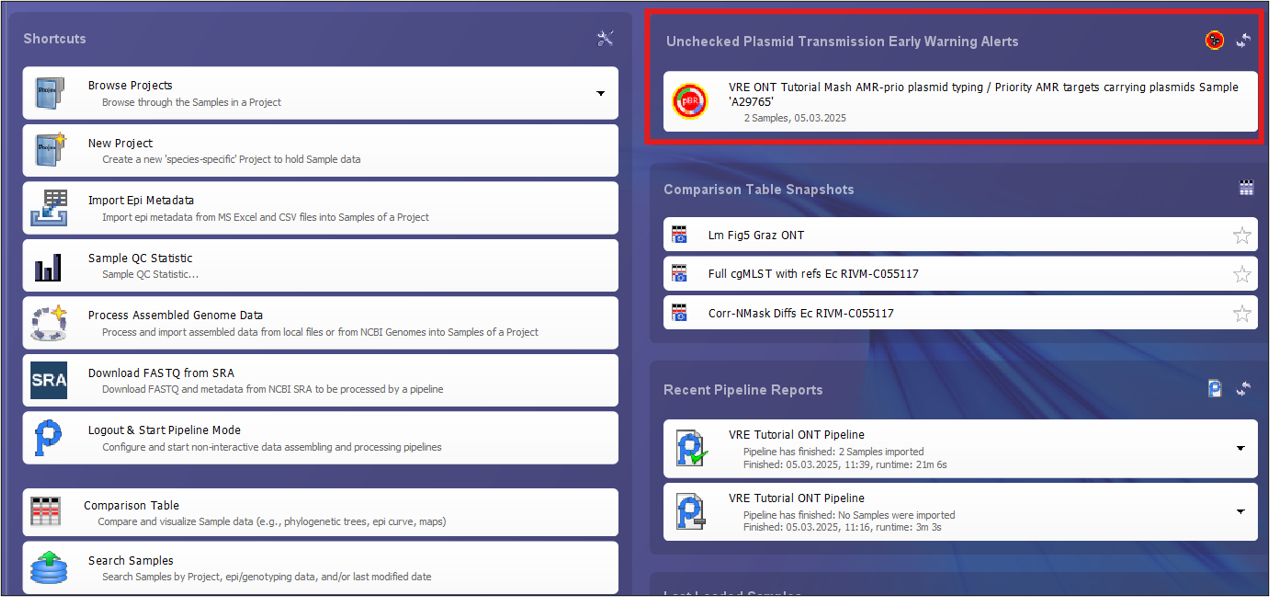
- Step 1: Log into the software again. On the top right of the home screen you will see a new entry under Unchecked Plasmid Transmission Early Warning Alerts.
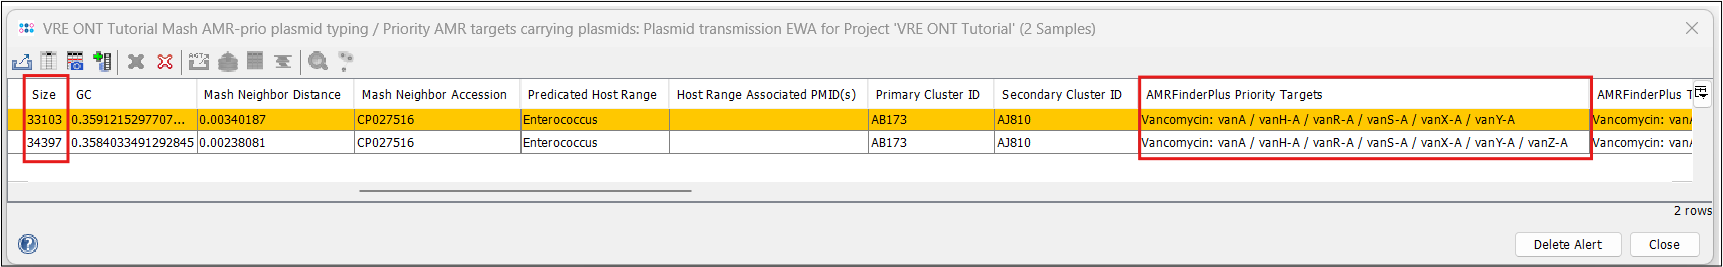
- Step 2: Click on the EWA to open a plasmid table showing the two plasmids that triggered the EWA. You can see that the two plasmids have a Mash distance of 0.0000 and their respective samples have a cgMLST distance of 17.
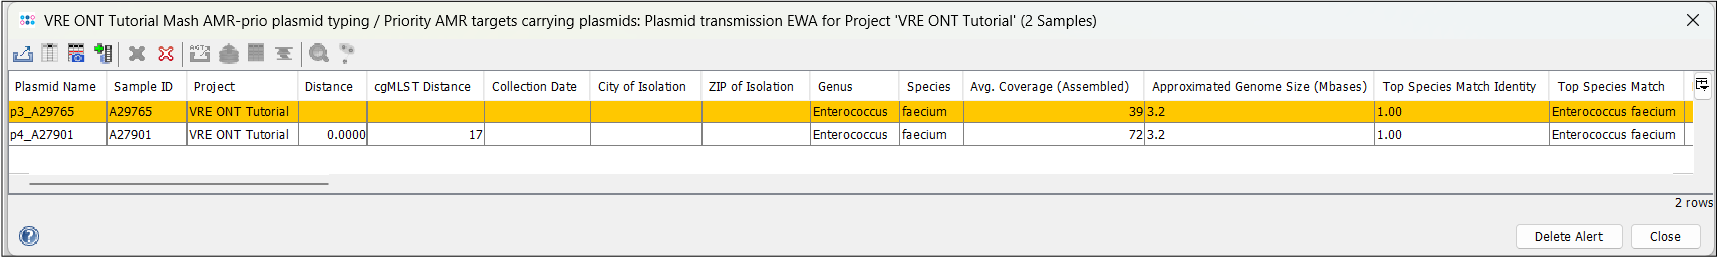
- Step 3: If you use the horizontal scrollbar, you can see further typing results, e.g. from the MOB-suite and NCBI AMRFinderPlus. Note that beside the high similarity, the plasmid of A27901 is slightly larger (34.4 vs 33.1 kb) and that A29765 is missing the vanZ gene of the operon.
- Step 4: To get a visual representation, select both plasmids and press
 Visualize Plasmids with pyGenomeViz. This will open a browser window with a graphical representation of the two plasmids.
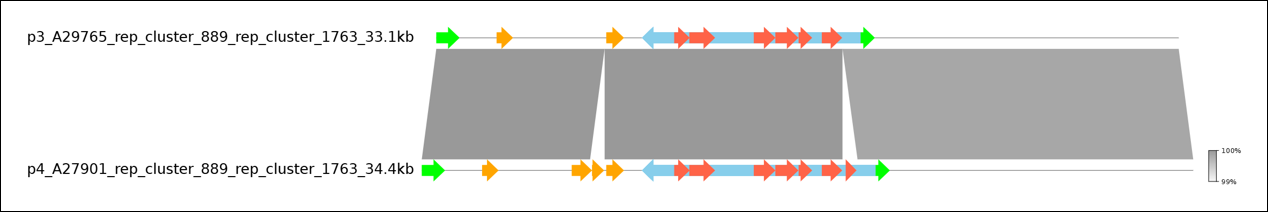
You can clearly see the high similarity between the two plasmids with the exception of two genes missing in A27901. If you hover of these genes with the mouse, you can see that the missing genes are vanZ, as already seen in the tabular view, and sat4, another AMR gene.
- This tutorial ends here. if you want to learn more about plasmid comparisons with long-read data, we suggest to do the Tutorial for Real-time Plasmid Transmission Detection and Alert from Long-read Sequencing Data and check out the documentation about the Long Read Plasmid Transmission.
FOR RESEARCH USE ONLY. NOT FOR USE IN CLINICAL DIAGNOSTIC PROCEDURES.