

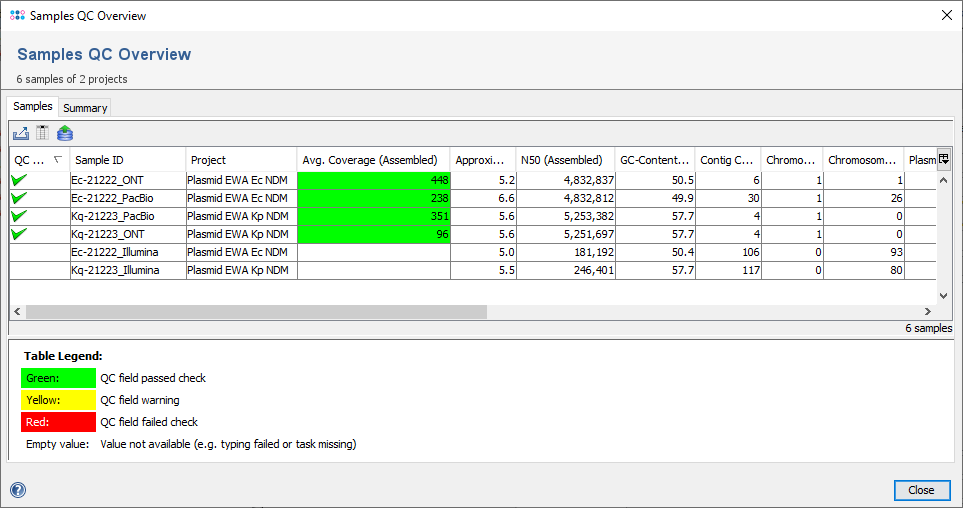
Invoke the function Tools | Sample QC Overview and Select all Samples of Project or Select Samples from database to view for the selected samples a table that summarizes all QC parameters. - The button Advanced allows to invoke the Target Level QC, that can be used to analyze the QC differences between targets of several samples.
Once the Sample QC Overview window is open the table in the first tab shows the important QC related procedure statistics fields. The columns of the QC fields are highlighted according to the QC result: green (QC ok), yellow (QC warning), or red (QC failed). The first column shows a summary of all evaluated QC fields. This column contains for each result of those fields an icon showing the specific QC result. The samples are by default sorted by this first column with the sample that has the worst QC result at the top. By clicking on column headings the samples can be sorted by other column results. If sequencing run details were imported for samples, their Run ID is also shown in the table and can be clicked to show the run details in complete. Similar statistics except the first column are shown also in the Pipeline Report and Sequencing Run Details.
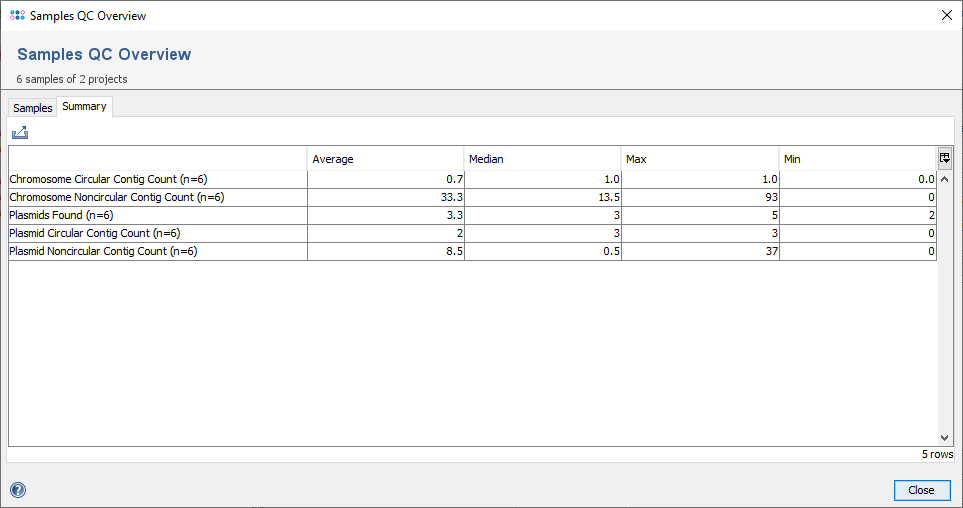
The second tab shows a summary statistic for some fields of the Chromosome and Plasmids Overview Task Template.
FOR RESEARCH USE ONLY. NOT FOR USE IN CLINICAL DIAGNOSTIC PROCEDURES.