
| wiki | search |
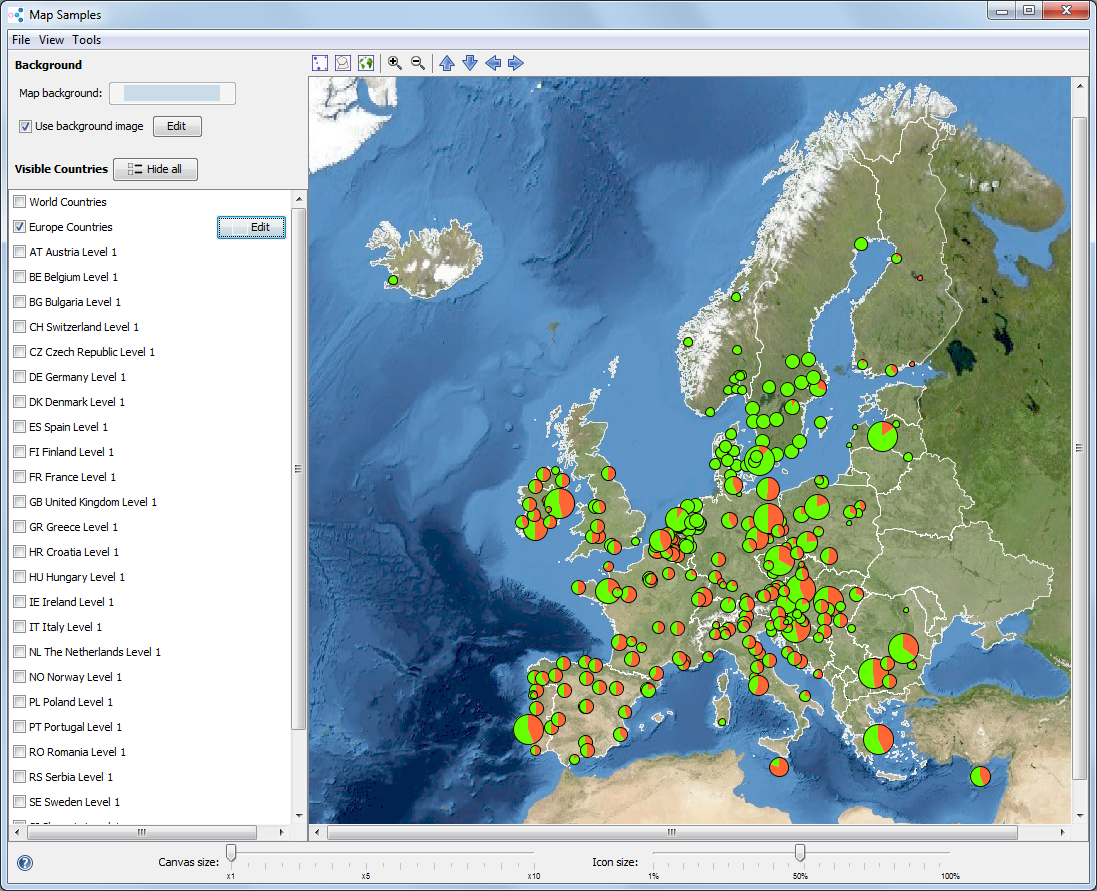
The Draw Map window displays Samples that have location information available (e.g. after using the geocoding function). The displayed Samples can be visualized in different forms, e.g. they can be colored according to their group.
Contents |
Appearance
The left column allows to choose the background for the map and the displayed countries/regions. Countries/regions can be switched on and off by using the check box next to their name. For each displayed country or region, a background color and a line color can be specified.
To quickly hide all countries/regions, use the ![]() Hide All button.
Hide All button.
The background image that is included in the software is a low-resolution relief-image of Earth supplied by Natural Earth. To use other images, the Edit button next to the background image checkbox can be used. This button opens the Background Image Settings dialog.
The map has a minimum size of 800x800px or fits the window if the window is larger. The Canvas size slider can be used to further enlarge the map. The Icon size slider can be used to modify the size of the icons for the Samples.
The visible rectangle can be moved using the Move North, Move South, Move West, or Move East commands. The Zoom In and Zoom Out commands zoom the visible rectangle. The visible rectangle can be fitted to all points, all countries selected in the left panel or the complete globe using the Fit to Points, Fit to Visible Countries, or the Fit to Globe commands.
Maps
The software is delivered with a world map and maps of several European countries. These maps are supplied by Natural Earth. The map data is supplied as public domain and can be used without any limitation. Note that Ridom does not take any responsibility for correctness or completeness of the map data.
Using own country maps
Own country or region maps can be provided in shape-file format. These Shape-files can be copied to a directory called "shape files" in the users home directory, e.g.
C:\Users\[username]\mlvacompare\shape files
Note that this directory might need to be created. Only Shape-files with a WGS84 lat/lon projection can be used. The Shape-files from the user directory will be listed at the bottom of the map-list.
Menu
File
- Export Map: Allows to export the map in different file formats:
- PNG raster image: exports the map as image. The exported image will have the same size as the displayed map, i.e. increasing the canvas size will increase the image size.
- SVG vector image: exports the map (without background image) as vector graphics. The exported image can be zoomed without loosing details.
- Google Earth KMZ: Export the Sample icons only for use in Google Earth. Clicking a Sample in Google Earth will open a table with the data for the Sample.
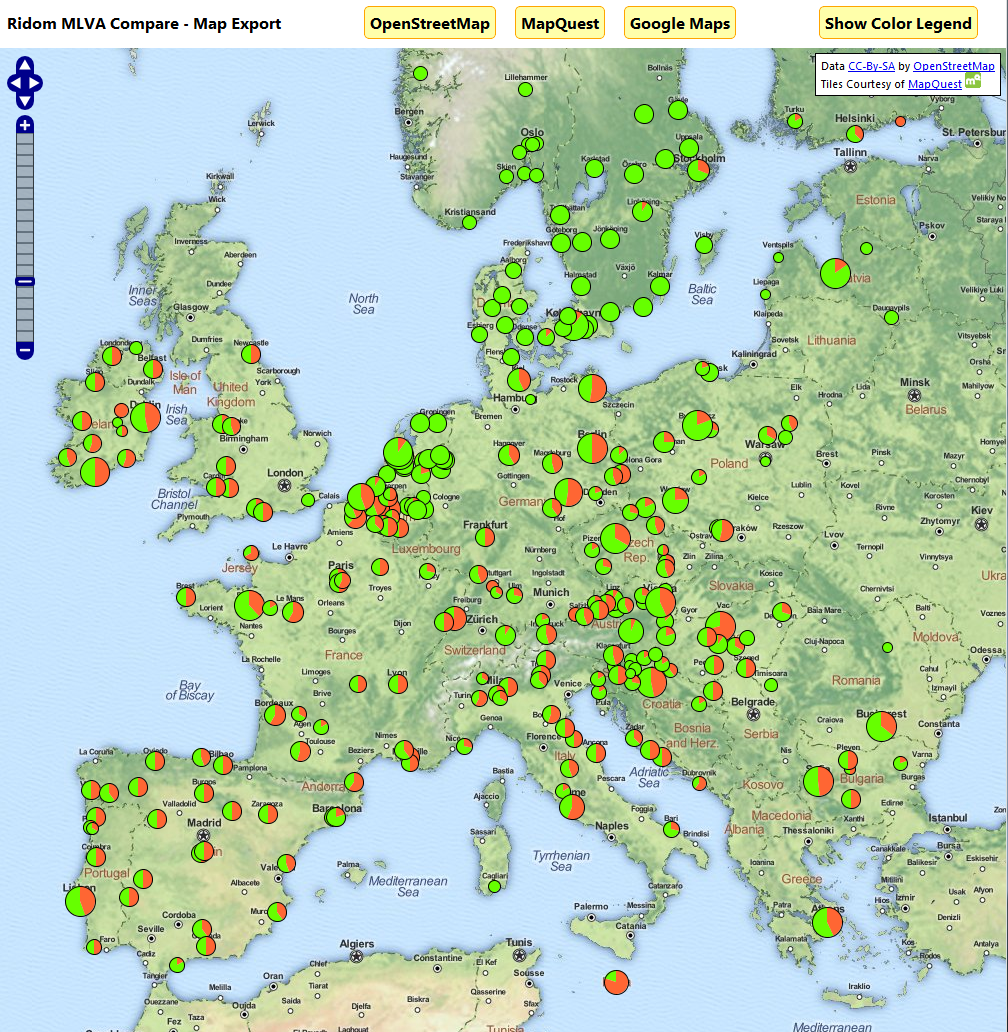
- OpenStreetMap and Google Maps HTML: Export the Sample icons only into a HTML-file that can be opened with a web browser. The HTML file uses data from OpenStreetMap, MapQuest and Google Maps to display the Samples. Clicking a Sample on the map will open a table with data for the Sample.
- The screenshots of the OpenStreetMap-map can be distributed under the Creative Commons Attribution-ShareAlike license, as long as attribution is given to OpenStreetMap. See Open Street Map copyright page for additional information.
- MapQuest open screenshots must contain attribution to OpenStreetMap and MapQuest (in form "Tiles Courtesy of MapQuest"), see MapQuest open page.
- Note that it is usually not allowed Google to distribute or publish Google Maps screenshots, see Google Geo Guidelines.
View
- Sample Display Options: Opens the Sample Display Options window that allows to choose how Samples are displayed on the map.
- Fit to Points: Change the visible rectangle so that all points are visible.
- Fit to Visible Countries: Change the visible rectangle so that all countries selected in the left panel fits the displayed area.
- Fit to Globe: Change the visible rectangle so that the complete globe is visible.
- Zoom In, Zoom Out: Zooms the visible rectangle.
- Move North, Move South, Move West, or Move East: Moves the visible rectangle.
- Show Cities: Allows to add cities to the map.
Tools
- Cumulate Points: Cumulates Samples that are contained in the same polygon of the map. This can be used e.g. to create a single icon for all Samples in a state or country. The lat/lon information in the table is not changed. The points are cumulated and centered by the countries/regions selected in the left panel. The calculation is done by simple geometry. Note that points close to borders or coastlines may be cumulated wrongly or at not at all because of imprecision in the map files.
- Reset Points: Resets the effect of the Cumulate Points function.
- Sort by Selected Nodes: If checked, the nodes that are selected in the map window are sorted to the top of the table.

Context Menu
Right-clicking the map area opens a context menu that shows the lat/lon coordinates of the clicked location and allows to select Samples up to a given distance around the location.