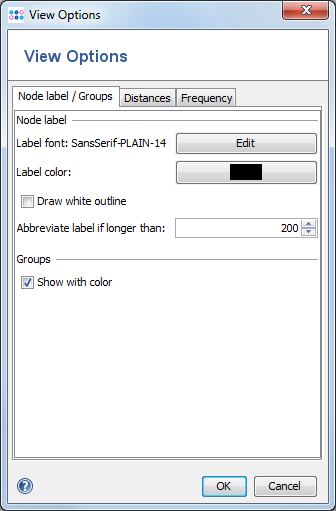
The visual appearance of a Minimum Spanning Tree (MST) can be modified using this window. The window contains tabs for different groups of settings.
Node label / Groups
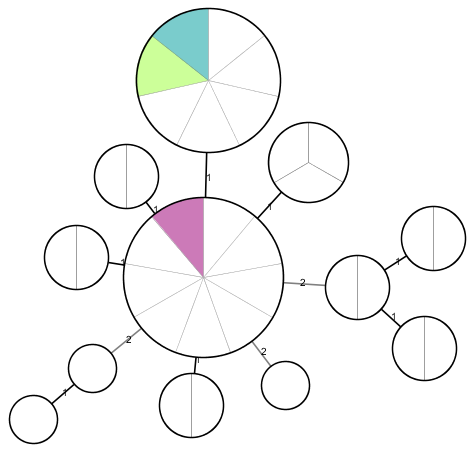
- Show with color: Check to color nodes according to the groups. If a node contains multiple Samples in a different group, the color information is presented as pie-chart.
The next options allow to change font, size and color of the node label. If the node label is longer than a given number of characters, it is abbreviated. The thin white outline that is painted around the label text can be switched off.
Distances
This tab allows to change how distance information is displayed.
- Use logarithmic scale for line length > XX: If checked, a logarithmic scaling is used to determine the length of the connection lines for all lines longer than XX. Note that after changing this options the MST will be re-layouted.
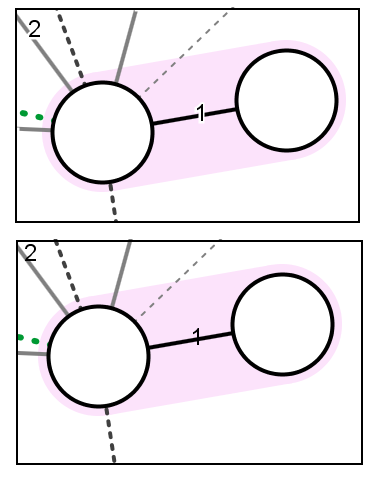
- Show distance numbers: Check to show distance numbers next to the connection lines.
- Font/Color: Change font, size and color of the distance numbers.
- Draw white outline: Should a small white outline be drawn around the distance number?
The next boxes allow to specify which line style can be used for which distances.
Frequency
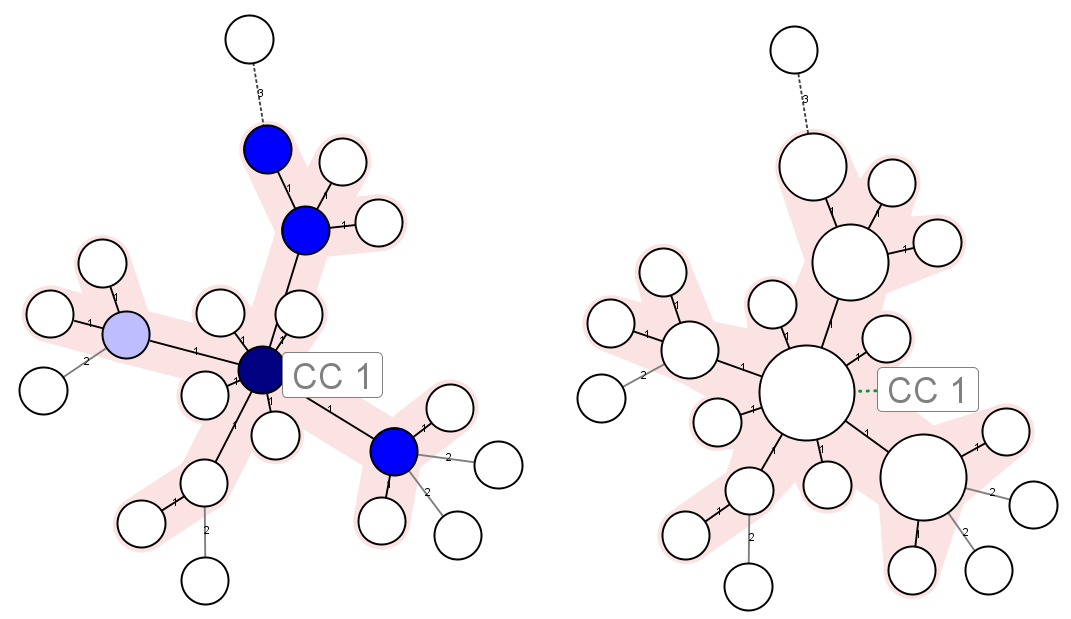
The number of Samples in a node/genotype can be displayed using colors or by changing the size of the nodes. Six different colors can be used to display the number of Samples using color. If the number of Samples is displayed using the size of a node, the minimal size, the maximum size of the node and how much the size is increased for each Sample in a node can be specified.
- Draw separator lines: Only available if frequency is not displayed using colors. Adds small separator lines into the Circles to display the Sample count.