

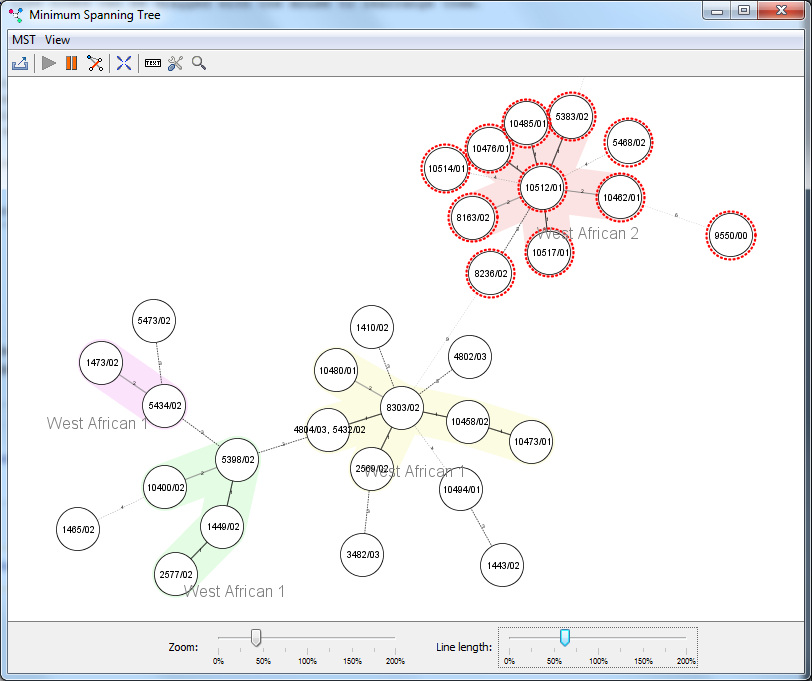
This windows displays a Minimum Spanning Tree (MST). The currently selected columns for distance calculation are used to create the MST. Multiple Samples can be represented by a single node based on their genotypes. The links between the nodes are based on the distance of the genotypes. The MST is calculated using a modified version of Kruskal's algorithm (Kruskal 1956). See Francisco et al. 2009 for a description of the MST algorithm. The layout is generated using a force-based algorithm. Due to the used algorithm lines may intersect with nodes or other lines, which can be corrected manually: the tree nodes can be dragged with the mouse to rearrange them.
A relaxing animation can apply the force-based algorithm to update the layout continuously to respond to user actions. The context menu can be used to lock positions of nodes or Complex labels if this is required.
Groups can be represented by the coloring of the circles. If the Samples in the node have different groups, the size of the circle arcs represents the number of strains..
One linked MST window can be displayed at a time, this window changes when the data or the columns for distance calculation change. An unlimited number of unlinked MST windows can be displayed, data changes will not update the MST in these windows.
All Samples in a node can be selected by clicking a node. The context menu can be opened by clicking a node with the right mouse button.
Contents
Distance Calculation
The MST is calculated using the Sample data for the columns that should be used for distance calculation.
Empty values or values that start with a ? are treated as missing values. Depending on the settings for Missing Values in MST these missing values are either treated as an own category or ignored during pairwise comparison. The Treatment of Missing Data command can be used to change the settings.
For a lower number of columns for distance calculation, (e.g. for MLVA data or MLST data), the missing values are an own category option is recommended. For a larger number of columns (e.g. cgMLST with thousands of targets) the pairwise ignore missing values option is recommended.
| Note that the option pairwise ignore missing values may result in problems in the MST when a Sample contains many missing values. In this case, many or all of the MST nodes might be merged. It is recommended to remove Samples that have missing values in more than 10% of the columns for distance calculation before calculating an MST. |
Complex
Genotypes can be grouped into Complexes by their locus difference to other genotypes. The settings for the Complexes can be modified in the MST Complex Options.
Menu
MST
-
 Export MST: Allows to export the MST in various formats:
- PNG: Exports a raster-image in the currently displayed resolution.
- SVG: Exports a vector graphic image that can be resized without loss of quality. The SVG-format is well suited for creating high-resolution graphics. See Image File Formats for more information.
-
 Start Animation: Starts the relaxing animation. The MST will slowly change its form until the force-based layout is optimized.
-
 Stop Animation: Stops the relaxing animation.
-
 MST Statistic: Displays extended information on how the MST was build.
- Treatment of Missing Data: Allows to choose if missing data should be handled as own category of if columns that contain missing values for at least one of the two genotypes are ignored during pairwise distance calculation for the MST. See Missing Values in MST.
-
 Disconnect MST from Table: Changes in the table will not update the MST any more. Opening a new MST window is possible after a MST was disconnected. This option can be used to compare MSTs for different data or settings. Note that the labels cannot be changed anymore after the MST was disconnected.
View
-
 Center MST: Fits the complete MST in the window.
-
 Choose Column for Label: Allows to select which column should be used to label the MST nodes. The View Options can be used to abbreviate the label if it is too long.
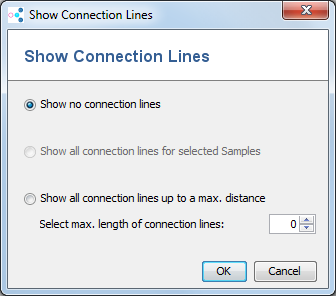
- Show Connection Lines: Allows to add additional connection lines to the tree. This turns the tree into a graph. This function can be used to check if the tree is reliable.
Two modes are available. Connection lines can be added- between all tree nodes up to a selected distance or
- between selected tree nodes. If only one node is selected, connection lines to all other nodes are added. If more than one node is selected, pairwise connection lines between selected nodes will be added.
-
 View Options: Opens a dialog window that allows to customize how the MST is displayed. A description can be found here: MST View Options.
- Complex Options: Opens a dialog window that allows to customize how the Complexes within a MST are defined and displayed. A description can be found here: MST Complex Options.
- Reset Default View/Complex Options: Sets the view and Complex options to default values.
-
 Export View/Complex Options: Allows to export the view and Complex options to a file.
-
 Import View/Complex Options: Allows to import the view and Complex options from a file.
- Name Complexes by Columns: Allows to name Complexes by the value in a column. The Complexes are named after the value of the first Sample in the Complex founder.
- Create Groups for Complexes: Replaces existing groups with a new group for each Complex.
- Sort by Selected Nodes: If checked, the nodes that are selected in the MST window are sorted to the top of the comparison table.
Panels
- Show ... Panel: Allows to toggle the visibility of the following panels: Complex Tree panel, group panel, zoom panel.
Most of the functions of the context menu are only available if a node is selected or a node was clicked.
- Select Complex: Only available if a node in a Complex was clicked. Selects all nodes in the Complex.
- Set Complex Color: Only available if a node in a Complex was clicked. Allows to change the background color of the Complex.
- Set Complex Name: Only available if a node in a Complex was clicked. Allows to change the name of the Complex.
- Add to Exclude List: Only available if at least one node is selected. Moves the selected nodes to the Comparison Table exclude list.
- Set Group: Only available if at least one node is selected. Allows to change the group of all Samples in the selected nodes.
- Lock Position: Only available if a node or a Complex label was clicked. The node cannot be moved anymore by the layout algorithm, but it still can be moved by dragging with the mouse.
References
- Kruskal JB, On the Shortest Spanning Subtree of a Graph and the Traveling Salesman Problem. Proc of the Am Math Soc, 1956 7:48–50
- Francisco AP, Bugalho M, Ramirez M, Carriço JA, Global optimal eBURST analysis of multilocus typing data using a graphic matroid approach, BMC Bioinform 2009, 10:152 (PubMed)