
| wiki | search |
Contents |
1 Overview
This tutorial describes how to use the Ridom SeqSphere+ software to analyze outbreak strains with MLST+.
Reference mapped Mycobacterium tuberculosis whole genome shotgun (WGS) data of 3 samples of a community outbreak is analyzed with the predefined public MLST+ schema for the M. tuberculosis complex.
M. tuberculosis is used exemplarily for this demonstration. However, by reading this tutorial you should be able to define your own projects for all species with a public available MLST+ schema in the Task Template Store. If you are analyzing a species for which no public MSLT+ is available yet, please take a look at the Tutorial for Rapid Local Ad hoc MLST+ or the Tutorial for Creating a Stable Expandable MLST+ Schema.
This tutorial requires the 64bit version of Ridom SeqSphere+.
2 Preliminaries
- Installation: This tutorial requires a running SeqSphere+ client and server. If not done yet: Download and install the SeqSphere+ client and server software on your computer. Start the SeqSphere+ server, then start the SeqSphere+ client and initialize the database. For evaluation purpose a free evaluation license can be requested.
- Tutorial Data: Download the example data archive SeqSphere_Examples_WGS_M_tuberculosis.zip for this tutorial, and extract the zip-file on your computer.
- The example data contains whole genome shotgun (WGS) data for 4 isolates of Mycobacterium tuberculosis. The isolates are part of retrospective study where isolates of 2150 patients were analyzed with classical genotyping (Hamburg, 15 years). All 4 isolates are identical for a certain IS6110 and Spoligo type (Haarlem lineage). 2 of the 4 isolates have an epidemiological link, the 2 others have no epidemiological link. The WGS data was reference mapped to strain H37Rv (MLST+ reference strain). The data was provided by S. Niemann et al., Research Center Borstel & R. Diel, Univ. Kiel, Germany (2013).
3 Creating the Project
- Step 1: Create a new Project with the menu: File | New | Project
- Step 2: Enter a name for your Project (e.g., MTBC outbreak). For the Mycobcaterium tuberculosis complex a special database schema exists that provides some species specific database fields. Choose Mycobacterium tuberculosis/bovis/africanum in the DB Schema field.
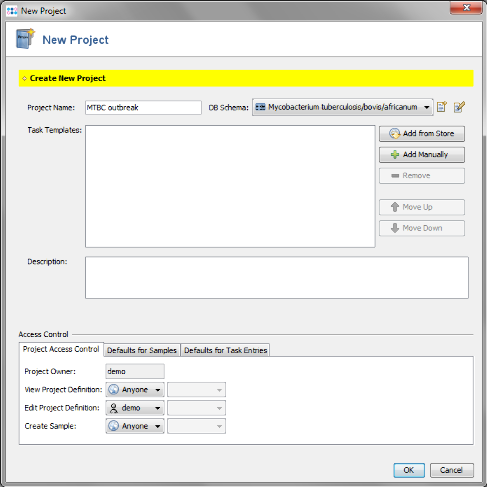
- Step 3: Press
 Add from Store in Task Templates section.
- Step 4: Choose as organism Mycobcaterium tuberculosis.
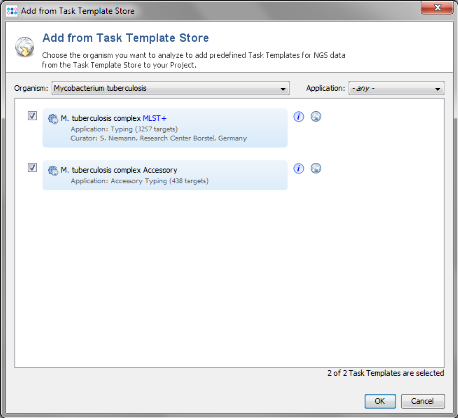
- Step 5: There are two Task Templates available for M. tuberculosis: MLST+ and Accessory. The MLST+ Task Template defines the 3257 genes of the reference strain H37Rv that are used for the stable typing and for the definition of the cluster type. The Accessory Task Templates defines in addition 438 genes that do not belong to the core genome. However, they can be used to increase the discriminatory power if the resolution of MLST+ is not high enough.
- Both Task Templates are preselected. Press OK to download and then OK to add them to the Project.
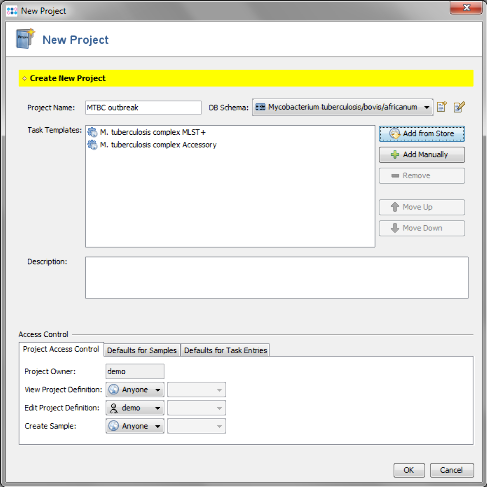
- Step 6: The Project now contains 2 Task Templates. Confirm with 'OK' to save the Project.
- Ridom SeqSphere+ is a resequencing software. Once you have setup your project you can literally analyze hundreds/thousands of sequence data automatically.
4 Import Outbreak Strains to MLST+
- Step 1: Choose from the menu File | Create Samples from Assembled Genomes
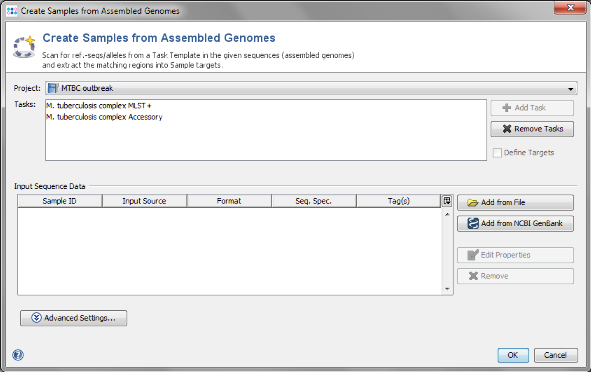
- Step 2: The new MLST+ Project you just created and the two Task Templates should be preselected already.
- Step 3: Now use the button
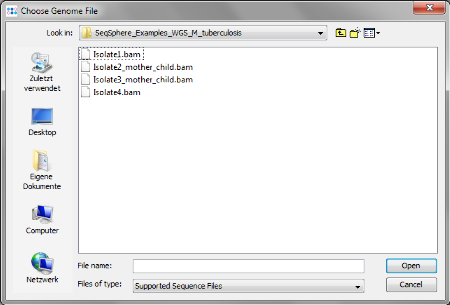
 Add from File and choose the 4 .bam-files from the tutorial data folder. Those files are NGS data reference mapped against H37Rv (NC_000962.3) which is the reference genome of the MLST+ schema.
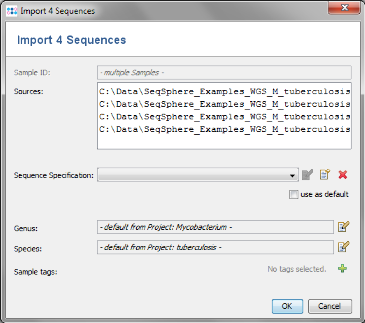
- Step 4: The upcoming window allows to specify sequencing information. Skip this step here by clicking OK. Confirm again with OK to start the import process.
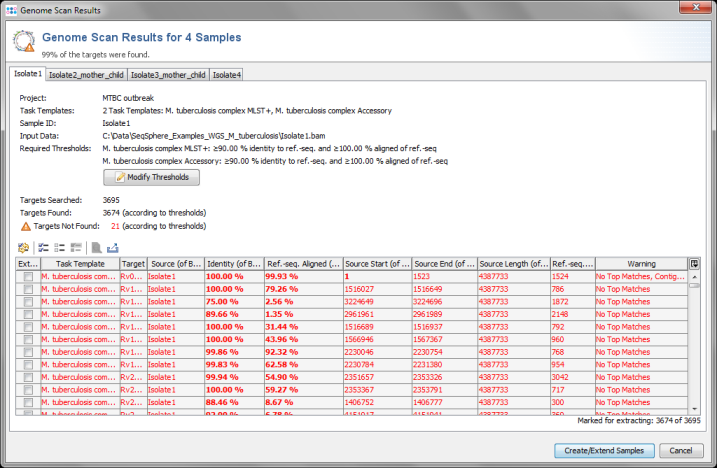
- Step 5: Ridom SeqSphere+ now loads all input data and searches for the target reference sequences that are defined in the Task Template (using a built-in BLAST) . After this step has been done, a preview window with scanning result for each input sequence file is shown. A table per Sample lists all the targets with the found matches. All targets that are checked in the first column of the table will be imported into SeqSphere+.
- The results for the targets are rated by specified thresholds for identity and aligned length of the best match (e.g., 90% identity to ref.-seq., and 100% aligned of ref.-seq.). The thresholds are defined in the Task Template, but they also can be changed in this preview step. Targets that do not have a match that reaches the thresholds, or targets that have multiple matches that reach the thresholds, will not be imported into SeqSphere+ by default. The rows of these targets are colored red. However, in this preview step these targets can still be selected manually by checking the box in the first column (e.g., if multiple matches should be ignored).
- This preview step is not shown when using the batch mode. For this tutorial all settings can be left to default, Confirm with the Create/Extend Samples button to continue.
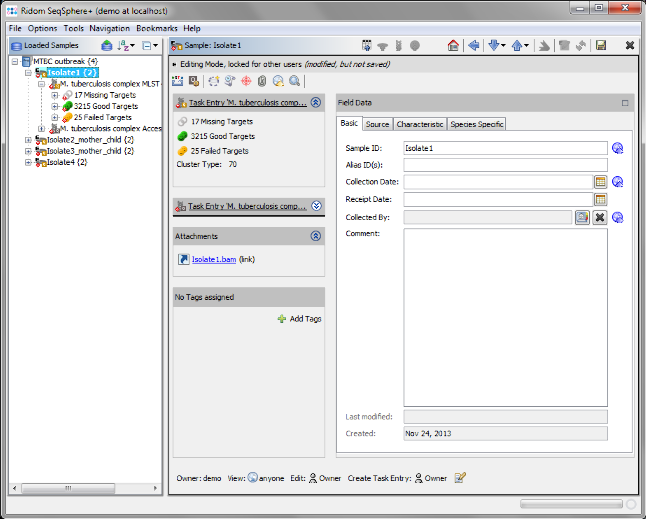
- Step 6: After the import is completed, the navigation tree shows all new Samples. Each Sample node in the navigation has two sub nodes: The MLST+ task and the Accessory task. Below the task nodes there are the target nodes. Each target node represents one sequence (here a gene) extracted from the input data (genomes or wgs contigs). The targets can have different states:
-
 Missing Targets (gray) were not extracted (because the match did not reached the thresholds in the previous step)
-
 Good Targets (green) were extracted and fulfilled all requirements that are defined in the Task Template Analysis Parameters.
-
 Failed Targets (yellow) were extracted, but failed at least in one of the requirements that are defined in those parameters. For example, they may have frame shifts and incorrect lengths compared to the published FAM18 strain sequence.
-
- Step 7: Select
 Tools | Position Navigator from the menu. Initially all yellow targets are selected, so just click OK.
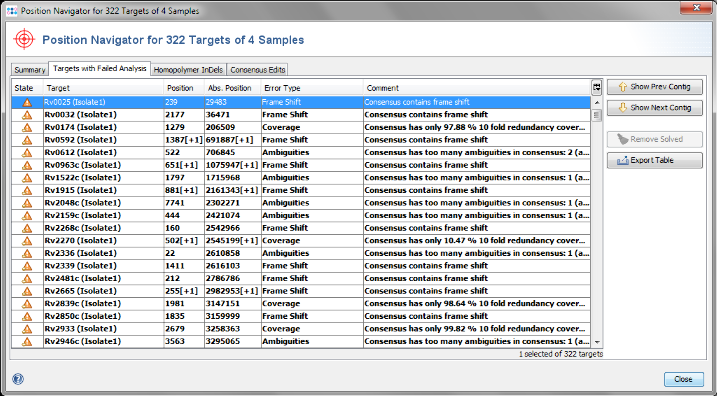
- Step 8: After a short while the Position Navigator is opened. Click on the tab Targets with Failed Analysis to see a table with the analysis problems that appeared in the imported sequence data. You can double click on a row in the table to jump to the according position in the contig.
- Step 9: Choose from the menu
 File | Save All to store the 3 Samples to the database on your SeqSphere+ server.
5 Phylogentic Analyzing with MLST+
- Step 1: Choose from the menu Tools | Comparison Table
- Step 2: Press New Definition.
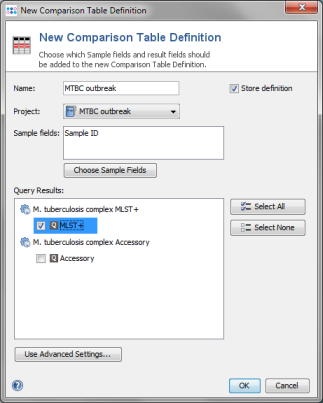
- Step 3: Enter a name for the Comparison Table (e.g., MTBC MLST+), choose the new project and select the MLST+ node in the query result section. Confirm with OK.
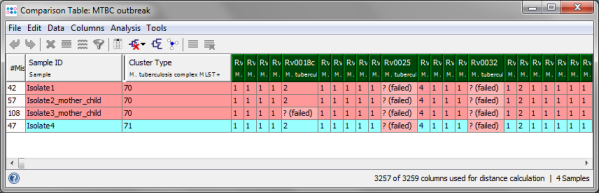
- Step 4: The comparison table is opened and shows the data for the three Samples. The columns with a green header are used for distance calculation. The rows are colored by the Cluster Type which is also shown in the third column. Some table cells contain missing values. Those appear if a MLST+ target was not found at all in an input sequence ("? (missing)"), or if the analysis for this target has failed, e.g., because of a frame shift error ("? (failed)"). The first column in the table shows number of missing values per row.
- Step 5: Press the
 Minimum Spanning Tree button in the toolbar to calculate the distances between the Samples and draw a minimum spanning tree for them. Because the table contains missing data, it must be confirmed that the columns containing at least one missing data should be removed from the distance calculation. Confirm with Remove Columns from Distance Calculation.
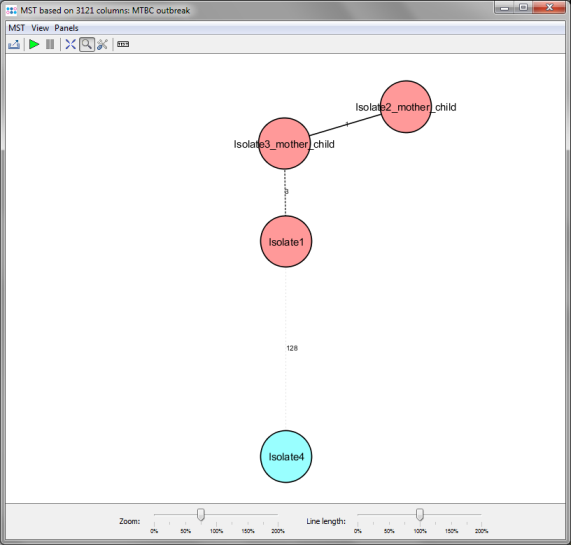
- Step 6: The number of MLST+ targets that are used for distance calculation is automatically reduced to the 3121 targets that have passed the analysis checks in all 4 isolates. For those targets the minimum spanning tree is calculated and shown in a new window. By default the nodes are again colored by the Cluster Type and it can be easily seen that 3 of the 4 isolates have the same Cluster Type. But Isolate4 has a different cluster type.
- Two conclusions can be drawn from this result;
- One of the isolates without epidemiological information (Isolate1) has a same cluster type and a close distance to the other 2 isolates (3 alleles) with epidemiological link (mother/child). This indicates epidemiological relationship for this isolate.
- The other isolate without epidemiological information (Isolate4) has a different cluster type and a distance of 128 alleles to the 3 others. This clearly excludes recent transmission for this isolate.