
| wiki | search |
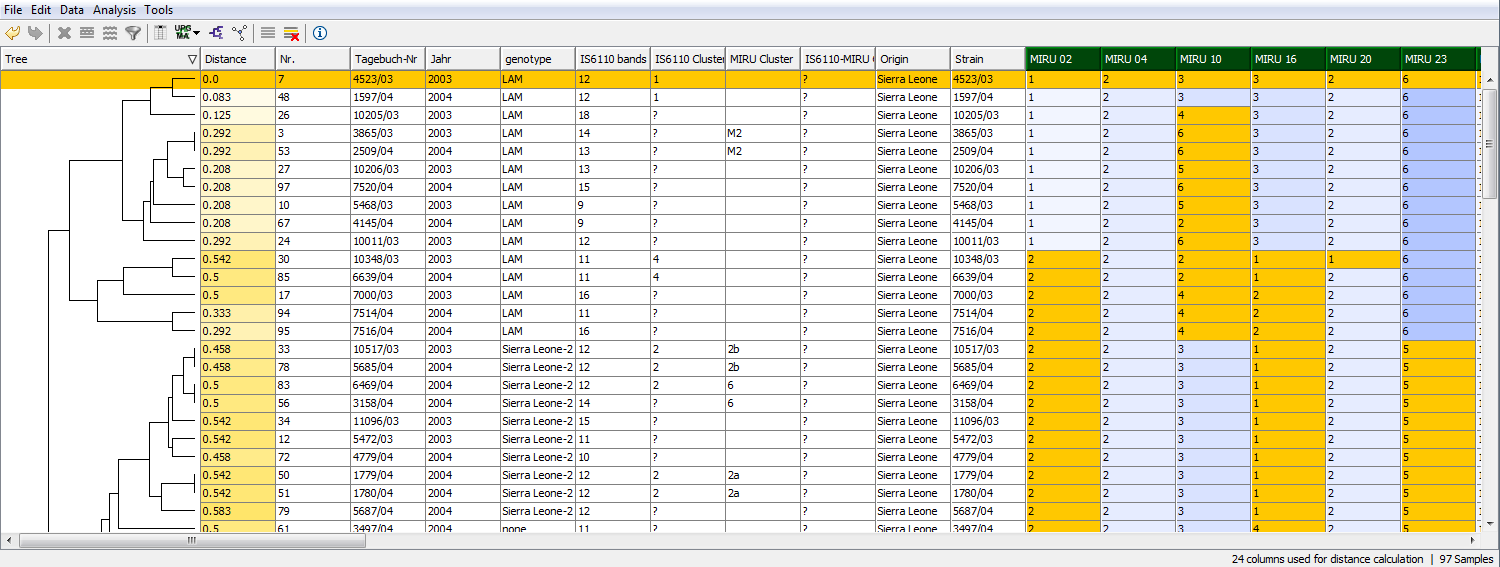
The Comparison Table shows Sample fields in a table. Data for each Sample is displayed in a row. Multiple columns can be used for distance calculation. The calculated distances can be used for various analysis functions:
- a Comparison Sample can be chosen. Distances to the Comparison Sample are calculated for all other Samples, and the differing values are highlighted in orange. A dialog window allows to select how distances are calculated.
- phylogenetic trees (Neighbor-joining or UPGMA) can be included in the table. Thereby the table can be ordered by position of Samples in the phylogenetic tree.
- a window with a phylogenetic tree can be opened
- a minimum spanning tree (MST) can be opened in a new window.
- Samples can be temporarily removed from analysis using the exclude list.
- a filter allows viewing only specific Samples (e.g. only Samples that have a certain value for a field).
- groups can be used to mark Samples with colors.
Contents |
Modifying data
Values for multiple Samples can be modified using the menu command Set Values for Selected Samples. To modify a simple table cell, double-click the cell.
Groups
Groups are used to mark specific Samples. Each group has a name and a color. To assign Samples to a group, select them in the data table and choose a group in the menu Data | Set Groups (or via the context menu).
To edit the available groups, select the command Manage Groups from the Data menu. A new window will open that contains a list of groups.
The menu command ![]() Set Groups by Value can be used to dynamically create groups based on the values of a Sample.
Set Groups by Value can be used to dynamically create groups based on the values of a Sample.
Distance Calculation
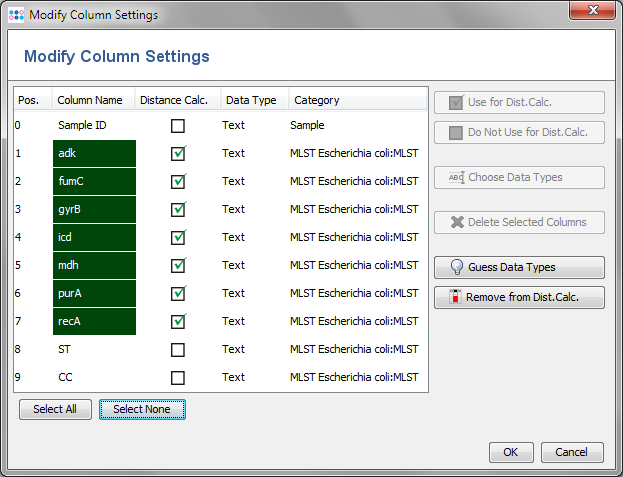
Some functions, namely the comparison Sample, the phylogenetic trees and the minimum spanning tree require that one or more columns are selected for distance calculation. Columns selected for distance calculation can be recognized by their dark-green column header. Columns for distance calculation can be chosen in two ways:
- by using the
 Modify Column Settings (via Data menu or toolbar button) or
- by clicking the right mouse button on the column header. This opens a context menu that allows choosing the data type for a column and if the column is used for distance calculation.
Data Types
Each column has a data type. Usually, the predefined data types are adequate. The data types can be changed in two ways:
- by using the Modify Column Settings (via Data menu or toolbar button) or
- by clicking the right mouse button on the column header. This opens a context menu, that allows choosing the data type for a column.
Menu
File
-
 Open: Open a stored .comptable file.
-
 Save Table: Save table as .comptable file.
-
 Import: Add data to the current table from a stored table (.comptable), MS Excel files (.xlsx, .xls) or CSV text-files.
-
 Join Tables: Join two tables using matching values.
-
 Paste Clipboard Content: Add data from the clipboard to the current table.
-
 Export Table: Export table in various formats:
- MS Excel (.xlsx): export the table including the table cell colors
- MS Excel 97-2003 (.xls): export the table data only
- CSV-file: export the table as comma separated values file
- HTML-file: export the table including the table cell colors as HTML table that can be viewed in a web browser
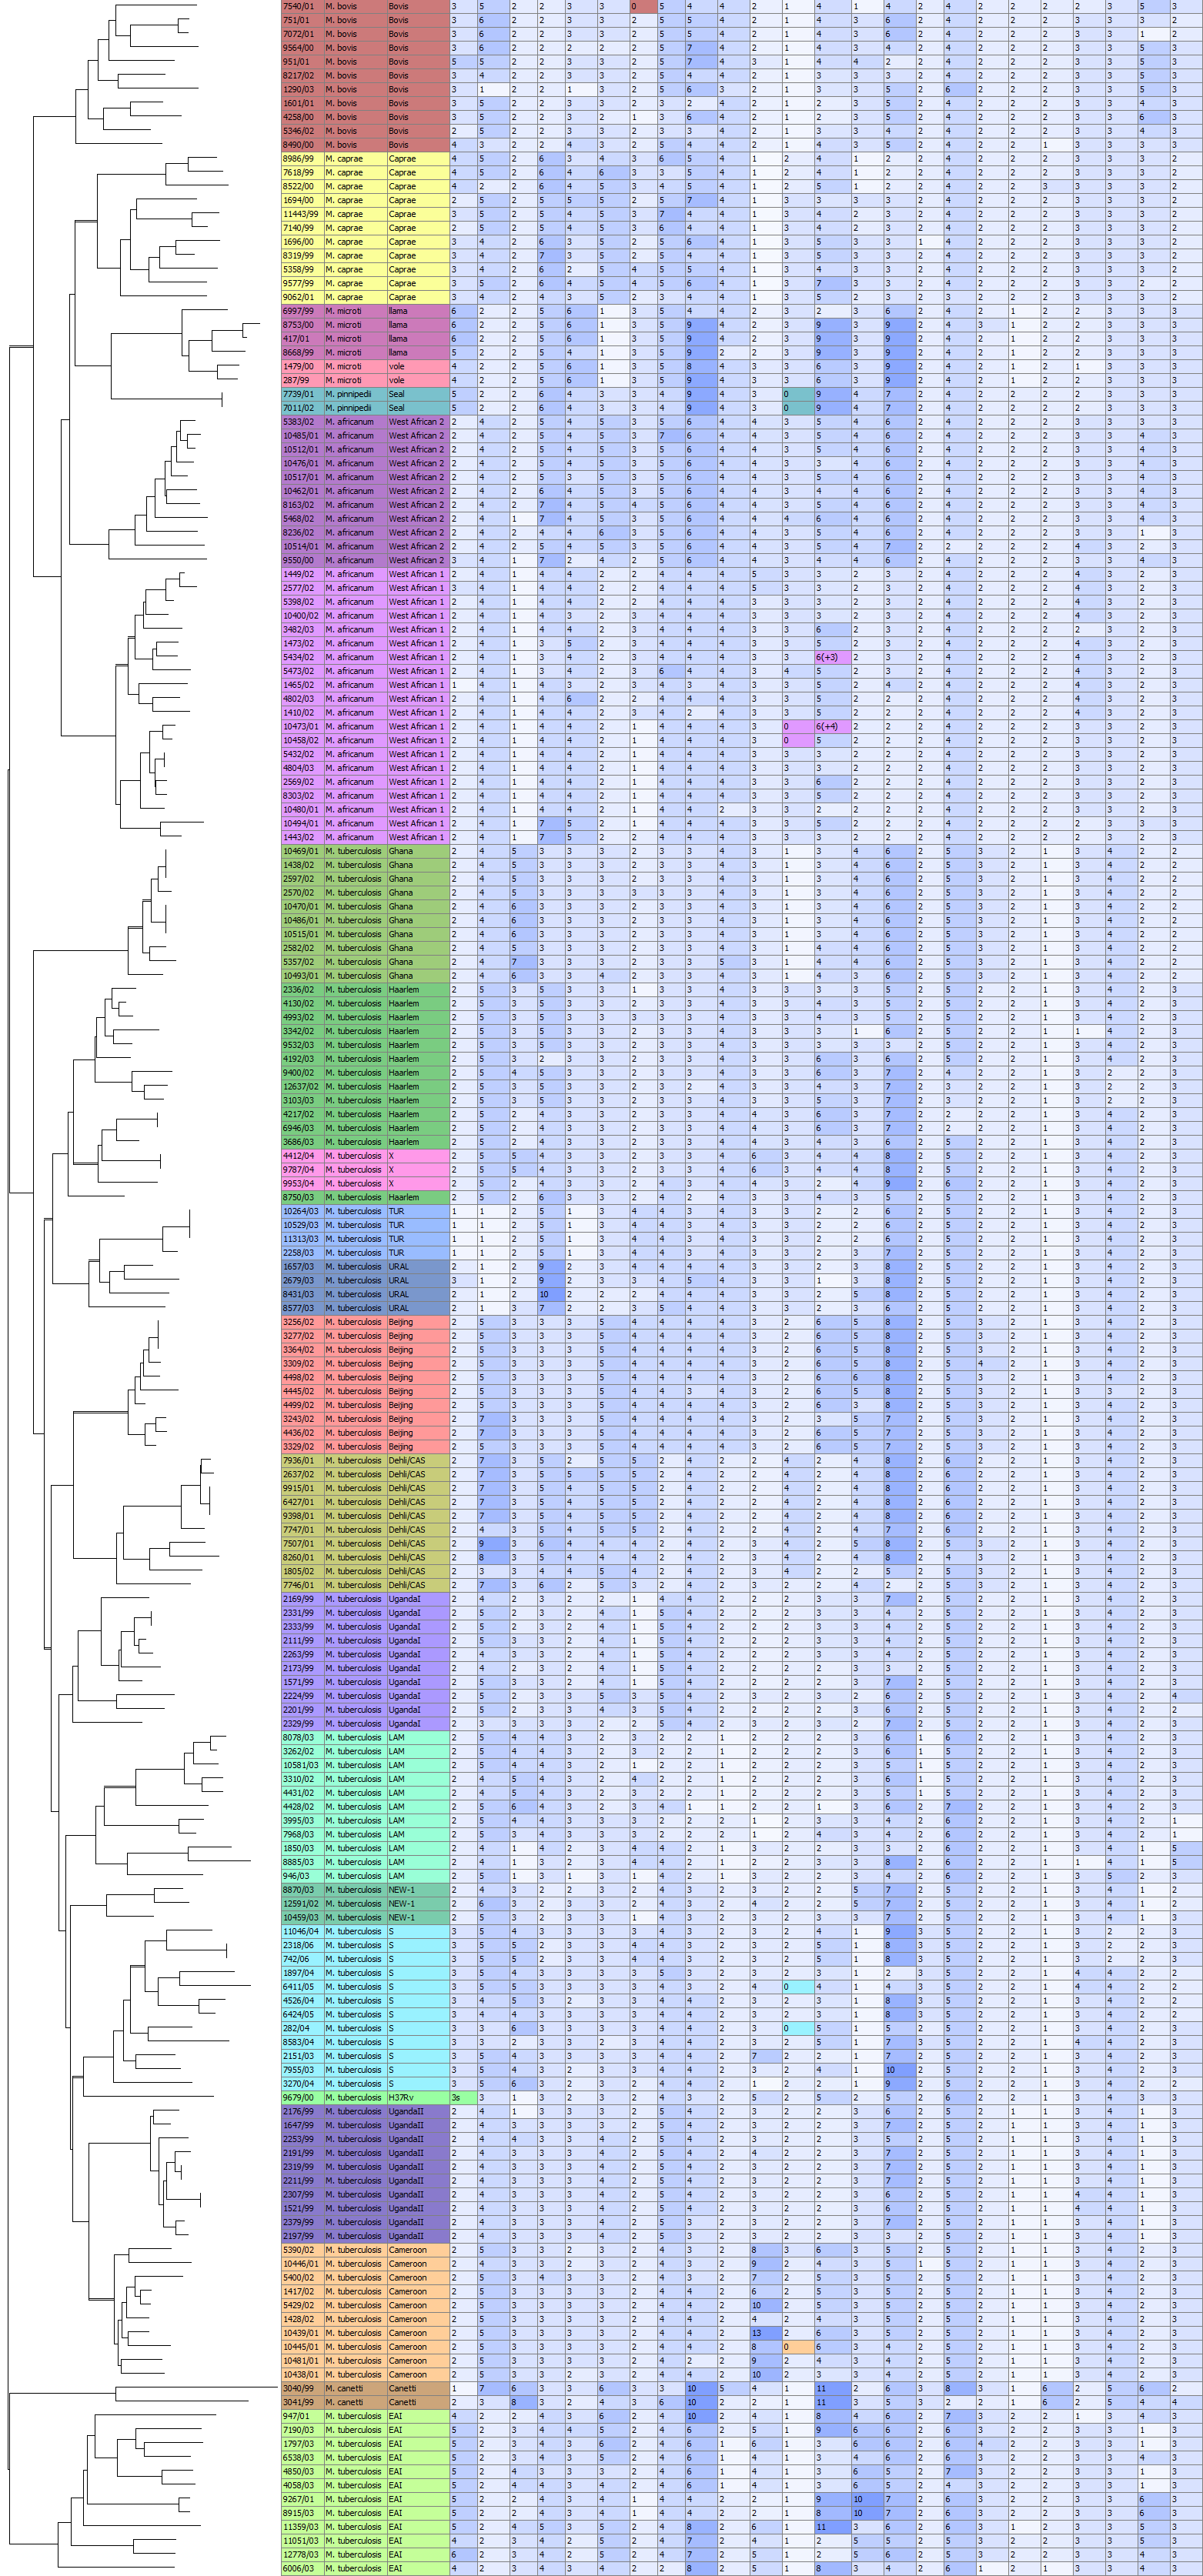
- PNG-file: exports the complete table, including the tree in the table if it is used as image. Note: This function might fail for large tables because of memory limitations. See example image.
-
 Clear Table: Clears the table, all filters, and the exclude list.
- Preferences: Opens the Preferences page.
-
 Exit: Exits the program.
Edit
- Select All: Selects all displayed Samples.
- Select None: De-selects all displayed Samples.
- Invert Selection: Inverts the current selection. All unselected Samples are selected, and all selected Samples are unselected
- Select Samples with Missing Values: Allows to select Samples that contain missing values in more than a specified percentage of columns for distance calculation.
- Select Samples by Values: Allows to automatically select Samples by values in a given column.
-
 Find: Searches for values in the complete table or in specific columns. The search ignores upper/lower-case.
- Set Values for Selected Samples: Allows to modify the values of a specific column for all selected Samples.
-
 Undo: Undoes the last command
-
 Redo: Does the last undone command again
Data
-
 Remove from table: Removes the selected Samples from the table.
-
 Add to Exclude List: Adds the selected Samples to the exclude list. The Samples on this list are not used in calculation anymore, but can be restored easily using the command Restore from Exclude List.
-
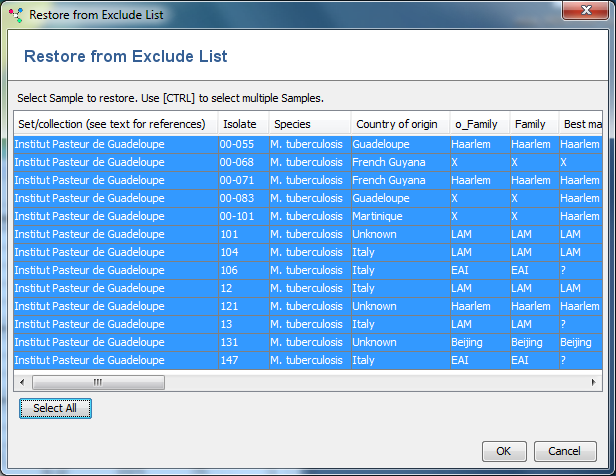
 Restore from Exclude List: Opens a window that displays all Samples in the exclude list and allows them to be removed from this list. All Samples that are selected are re-added to the Comparison table. Hint: Use CTRL to select multiple Samples.
-
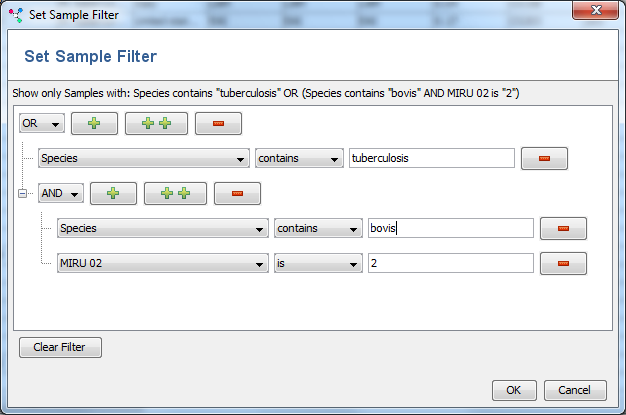
 Set Sample Filter: Opens a window to select a filter. Only Samples that match this filter are displayed in the table and used in calculation.
- Manage Groups: Opens a window for managing all existing groups. Groups can be added or removed, and the names and colors of existing groups modified.
- Set Groups: If one or more Samples are selected, this sub-menu can be used to assign groups to the Samples. Select none to remove the Samples from a group.
-
 Set Groups by Value: Automatically creates groups based on the values that are present in a column and assigns Samples to these groups according to these values.
Columns
-
Modify Column Settings: Opens a window to select the Data Types for each column and to choose which columns can be used for distance calculation.
- Select Column Categories for Distance Calculation: Allows to select one or multiple column categories (which corresponds to a Query) for distance calculation.
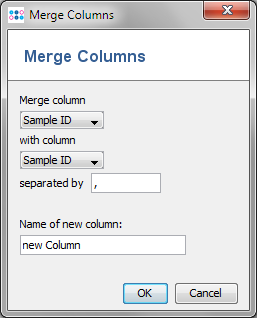
- Merge Columns: Creates a new column from two given columns. A separator can be specified that is used to separate the content of the two columns.
-
 Add Additional Database Fields as Columns: Allows to add additional fields from the database to the Comparison Table.
- Create Column with Sample Groups: Creates a new column that contains the group names for each Sample.
- Remove Columns with Single Values: Removes all columns that contain the same value in all cells (including empty columns).
- Show Missing Values in Distance Columns Count: When selected, the number of missing values in distance calculation is the first column for each Sample.
Analysis
-
 Set as Comparison Sample: Only available if exactly one Sample is selected. The selected Sample is used as Comparison Sample, and distances to all other Samples are calculated. Note that at least one column must be selected for distance calculation.
-
 Remove Comparison Sample: Only available if a Sample was selected as Comparison Sample. Removes the Comparison Sample and the distance column.
- Tree in Table: Select one of
 UPGMA-Tree in Table tree or
  NJ-Tree in Table to include the tree in the table. The tree is based on the columns that are selected for distance calculation. The Samples in the table are ordered according to their position in the tree. Choose
  No Tree in Table to remove the tree from the table.
-
 Draw Tree: Opens a phylogenetic tree window to display UPGMA- or NJ-trees.
-
 Minimum Spanning Tree: Opens a Minimum Spanning Tree window to calculate and modify a MST.
Tools
-
 Do Geocoding: Opens the Geocoding window that allows to find Latitude and longitude coordinates for Postal codes and country names.
-
 Show Map: Opens the Map window that displays the Samples on a map.
Context menu
Clicking on the table with the right mouse button opens the context menu which contains a subset of the commands described in the menu above:
- Remove from Table
- Add to Exclude List
- Set as Comparison Sample
- Remove Comparison Sample
- Set Group
- Open Samples: Opens the selected Samples in the Ridom SeqSphere+ main window.
Toolbar
The toolbar contains a subset of the command described in the menu section.